Figure 3.5
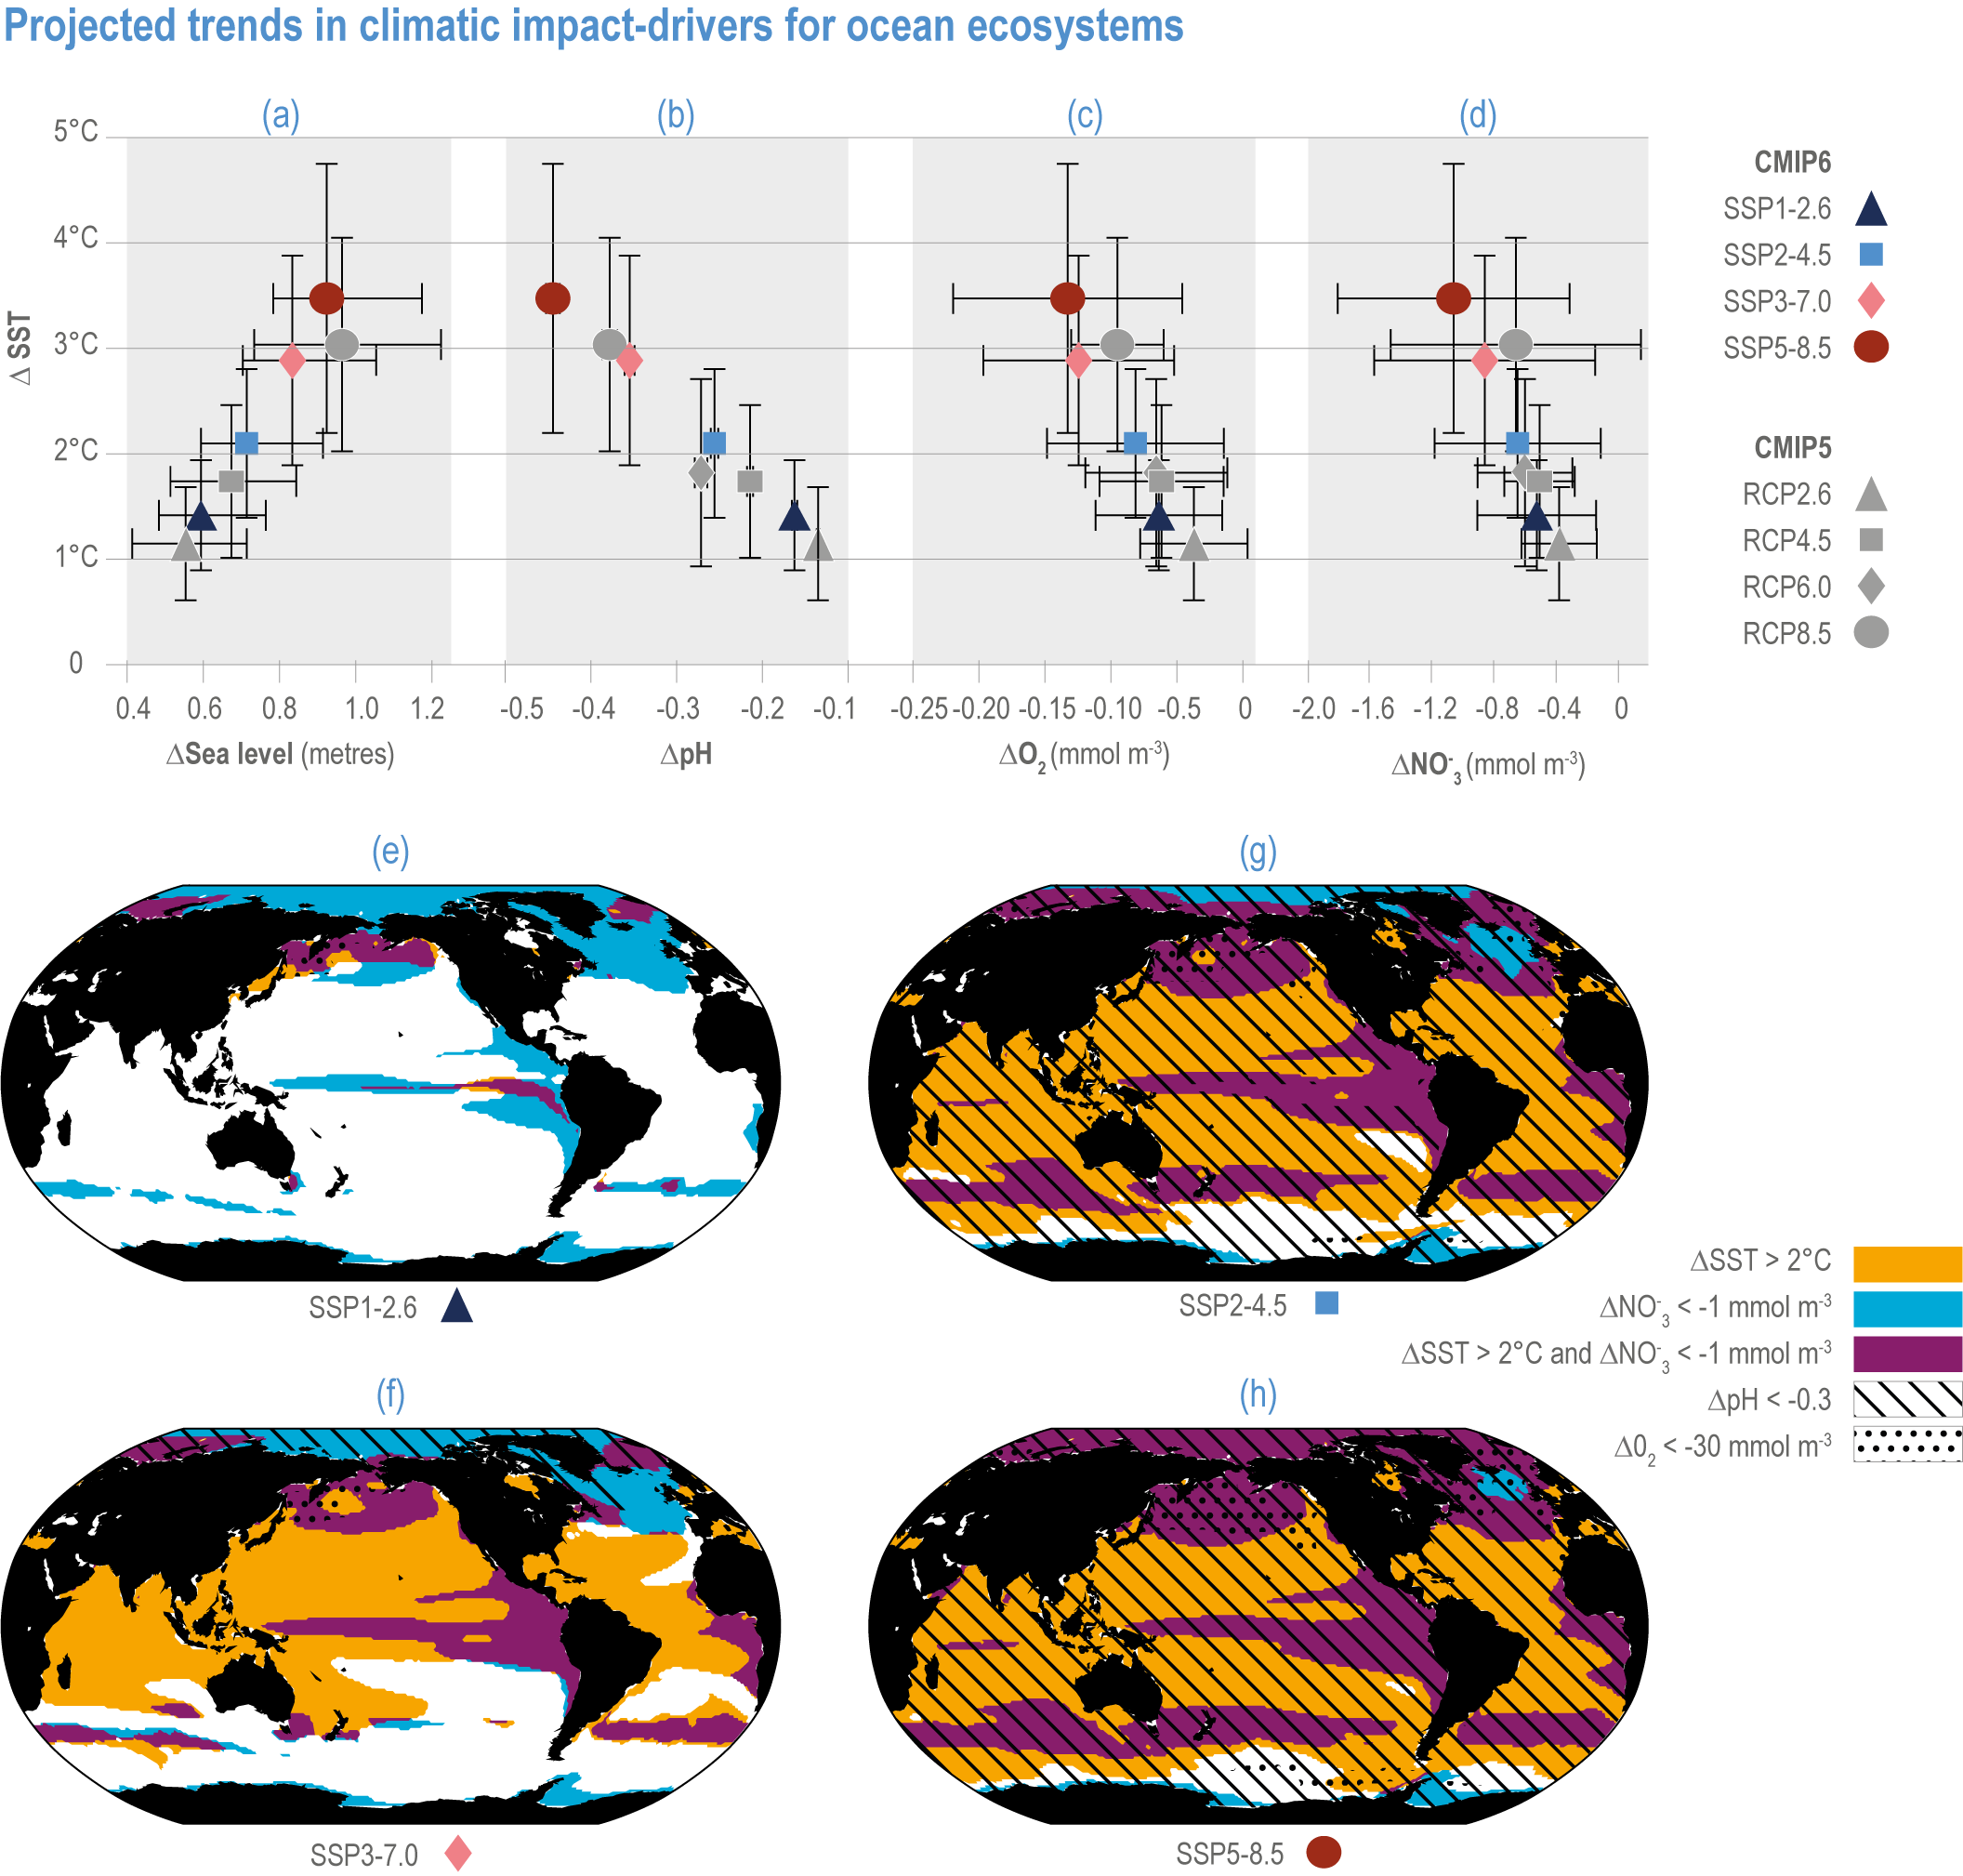
Figure caption
Figure 3.5 | Projected trends in climatic impact-drivers for ocean ecosystems. Panels (a,b,c,d) represent Coupled Model Intercomparison Project 5 (CMIP5) Representative Concentration Pathway (RCP) and CMIP6 Shared Socioeconomic Pathway (SSP) end-of-century changes in (a) global sea level; (b) average surface pH, (c) subsurface (100–600 m) dissolved oxygen concentration and (d) euphotic-zone (0–100 m) nitrate (NO3) concentration against anomalies in sea surface temperature. All anomalies are model-ensemble averages over 2080–2099 relative to the 1870–1899 baseline period (from Kwiatkowski et al., 2020), except for sea level, which shows model-ensemble median in 2100 relative to 1901 (from AR6 WGI Chapter 9). Error bars represent very likely ranges, except for SLR where they represent likely ranges. Very likely ranges for pH changes are too narrow to appear in the figure (see text). Panels (e,f,g,h) show regions where end-of-century projected CMIP6 surface warming exceeds 2°C, where surface ocean pH decline exceeds 0.3, where subsurface dissolved oxygen decline exceeds 30 mmol m-3 and where euphotic-zone (0–100 m) nitrate decline exceeds 1 mmol m-3 in (e) SSP1-2.6, (f) SSP2-4.5,
(g) SSP3-7.0 and (h) SSP5-8.5. All anomalies are 2080–2099 relative to the 1870–1899 baseline period. (Modified from Kwiatkowski et al., 2020).