Figure 3.9
Figure caption
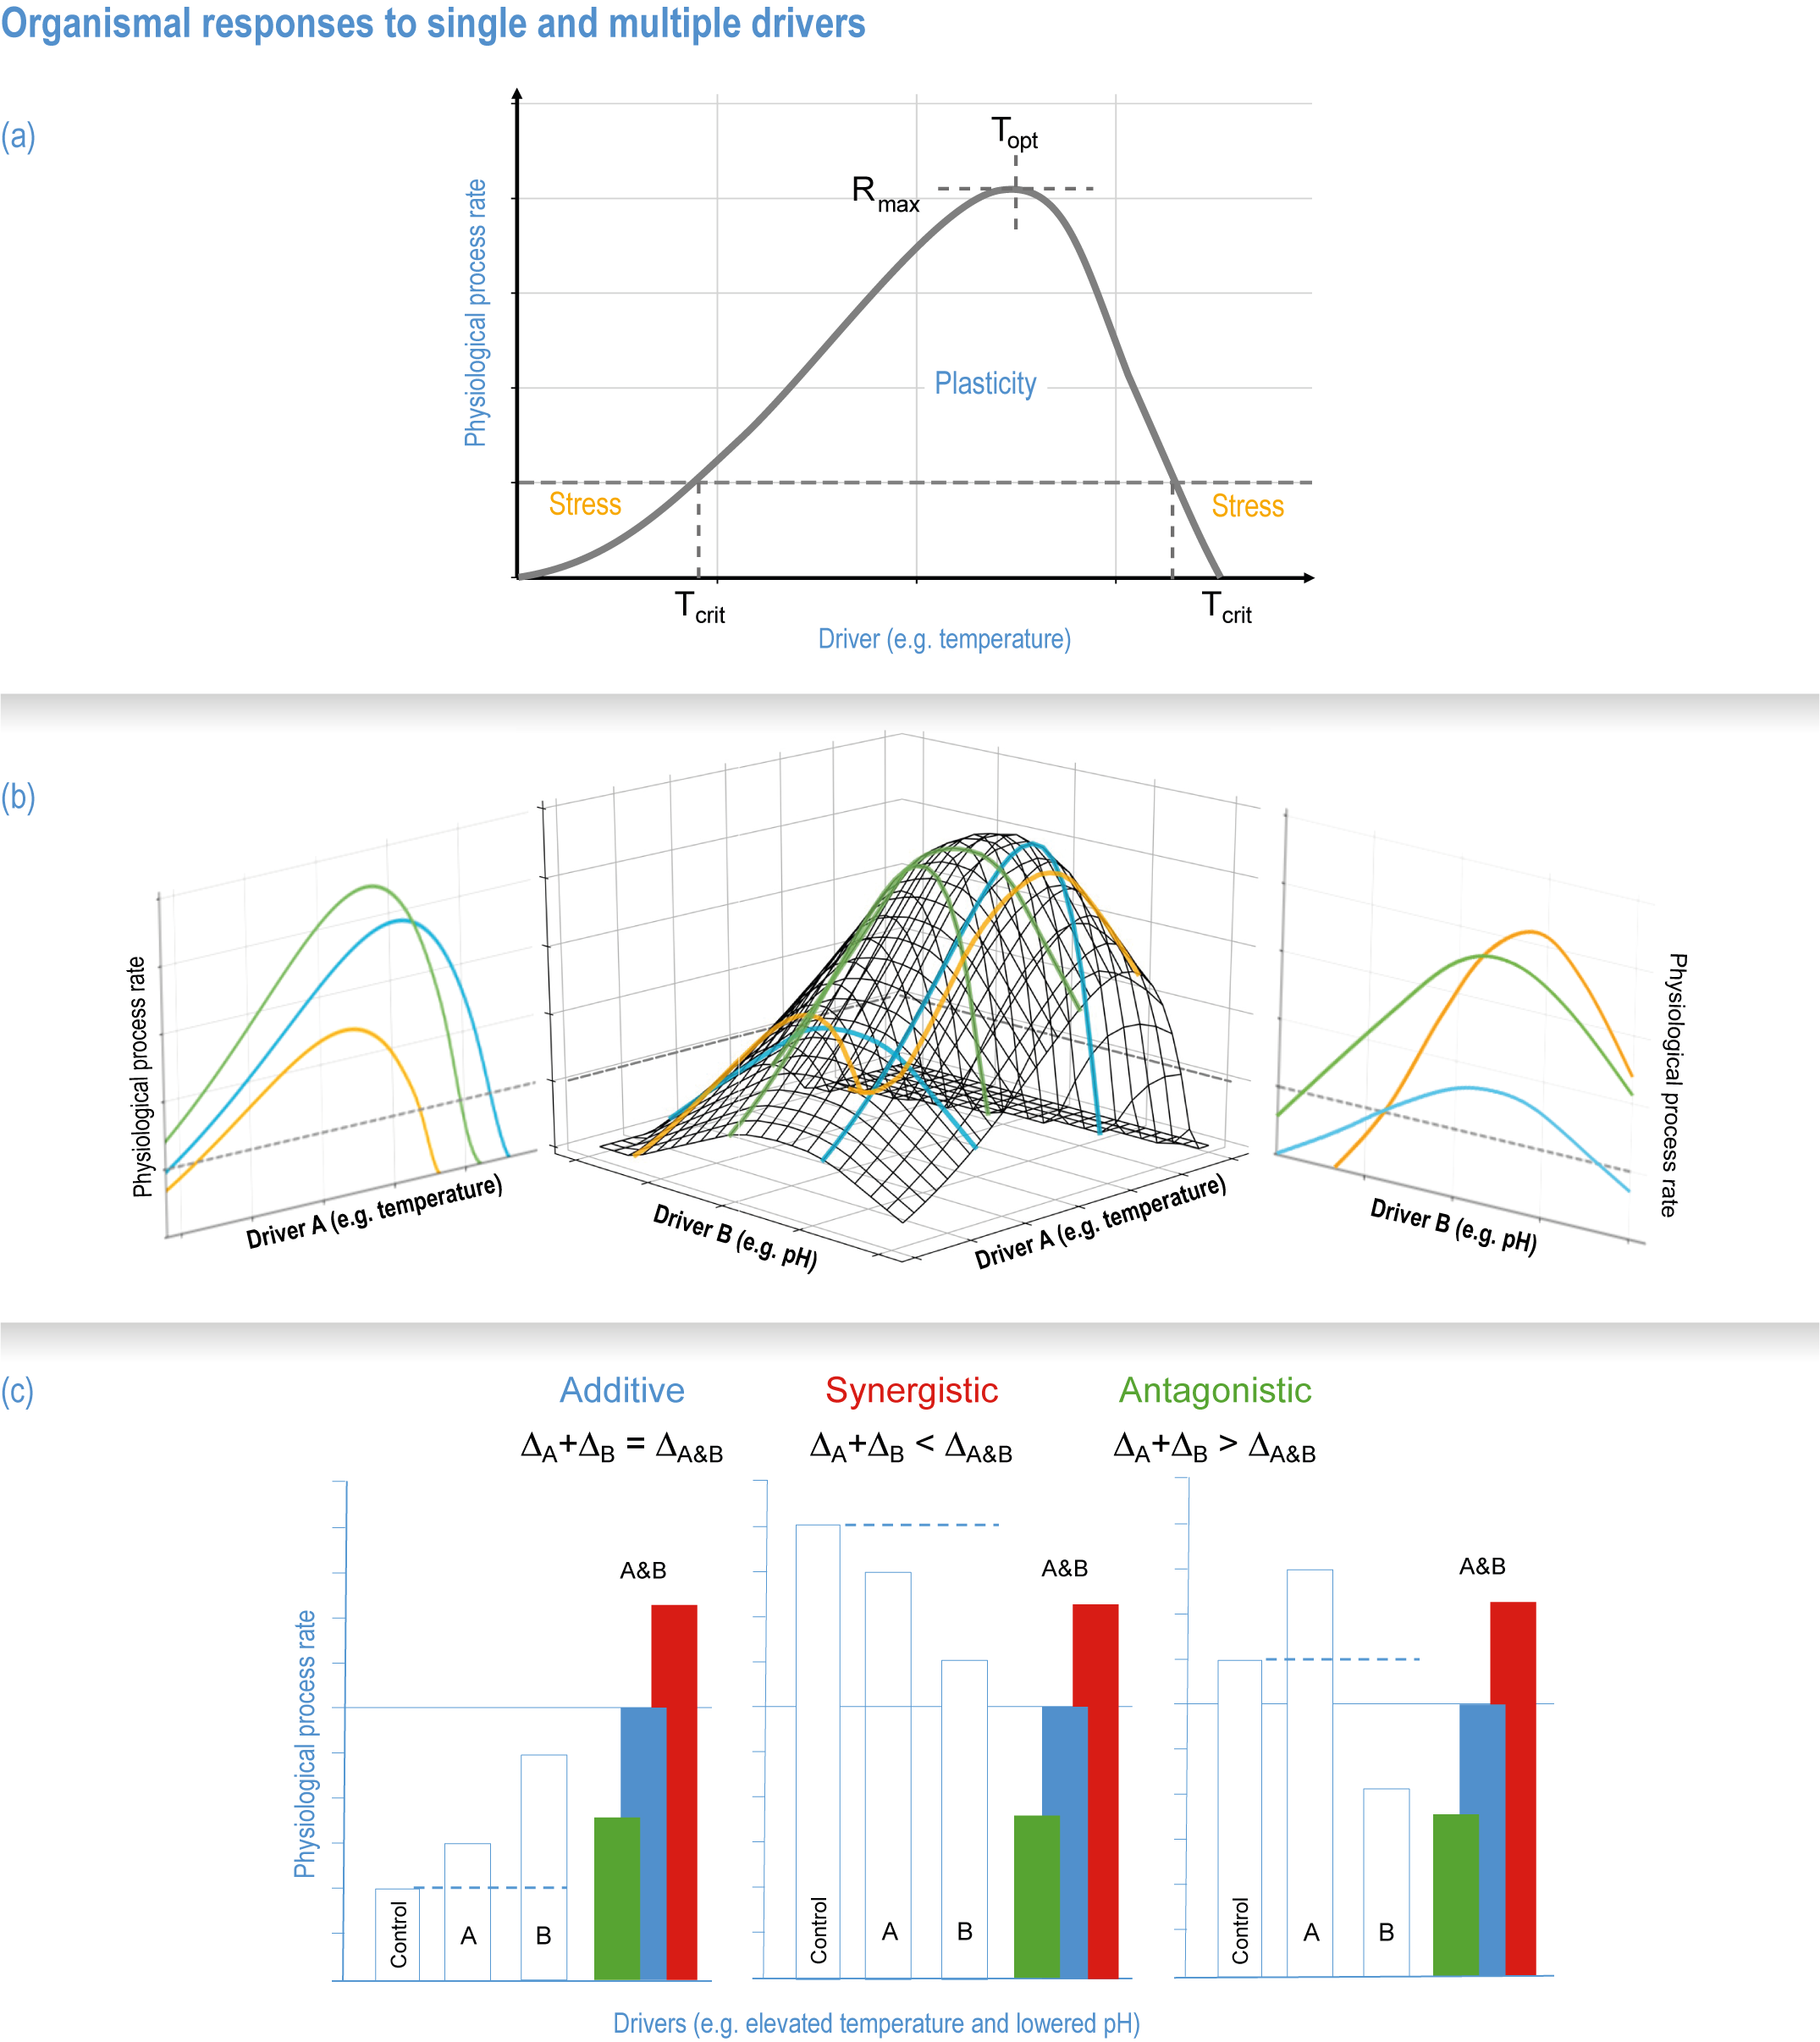
Figure 3.9 | Organismal responses to single and multiple drivers.
(a) The generic temperature–response curve shows physiological process rates as a nonlinear function of a particular driver (e.g., temperature) with maximum rates (Rmax) and temperature optima (Topt ). The driver range that keeps physiological rates above a certain threshold represents the organism’s range of phenotypic plasticity, while below that threshold, the critical temperature (Tcrit ), physiological performance is so low as to constitute stressful conditions.
(b) The response curve for one driver can depend on other drivers, here exemplified for temperature and pH in the central panel. This interaction causes rates as well as optima to change with pH (left) and temperature (right), indicated by the coloured lines. (c) Impacts of multiple drivers on processes can be additive (blue), synergistic (red) or antagonistic (green), that is, the cumulative effects of two (or more) drivers are equal to, larger than or smaller than the sum of their individual effects, respectively. Potential experimental outcomes affected by additive, synergistic and antagonistic interactions are shown for scenarios where drivers increase rates (left), decrease rates (centre) or cause opposite responses (right), showing how experimental outcomes can mask these mechanistic interactions. (For a quantitative analysis of effects of driver pairs on animals, see Figure 3.SM.2.) (Adapted from Crain et al., 2008 and Piggott et al., 2015).
