Figure 3.20
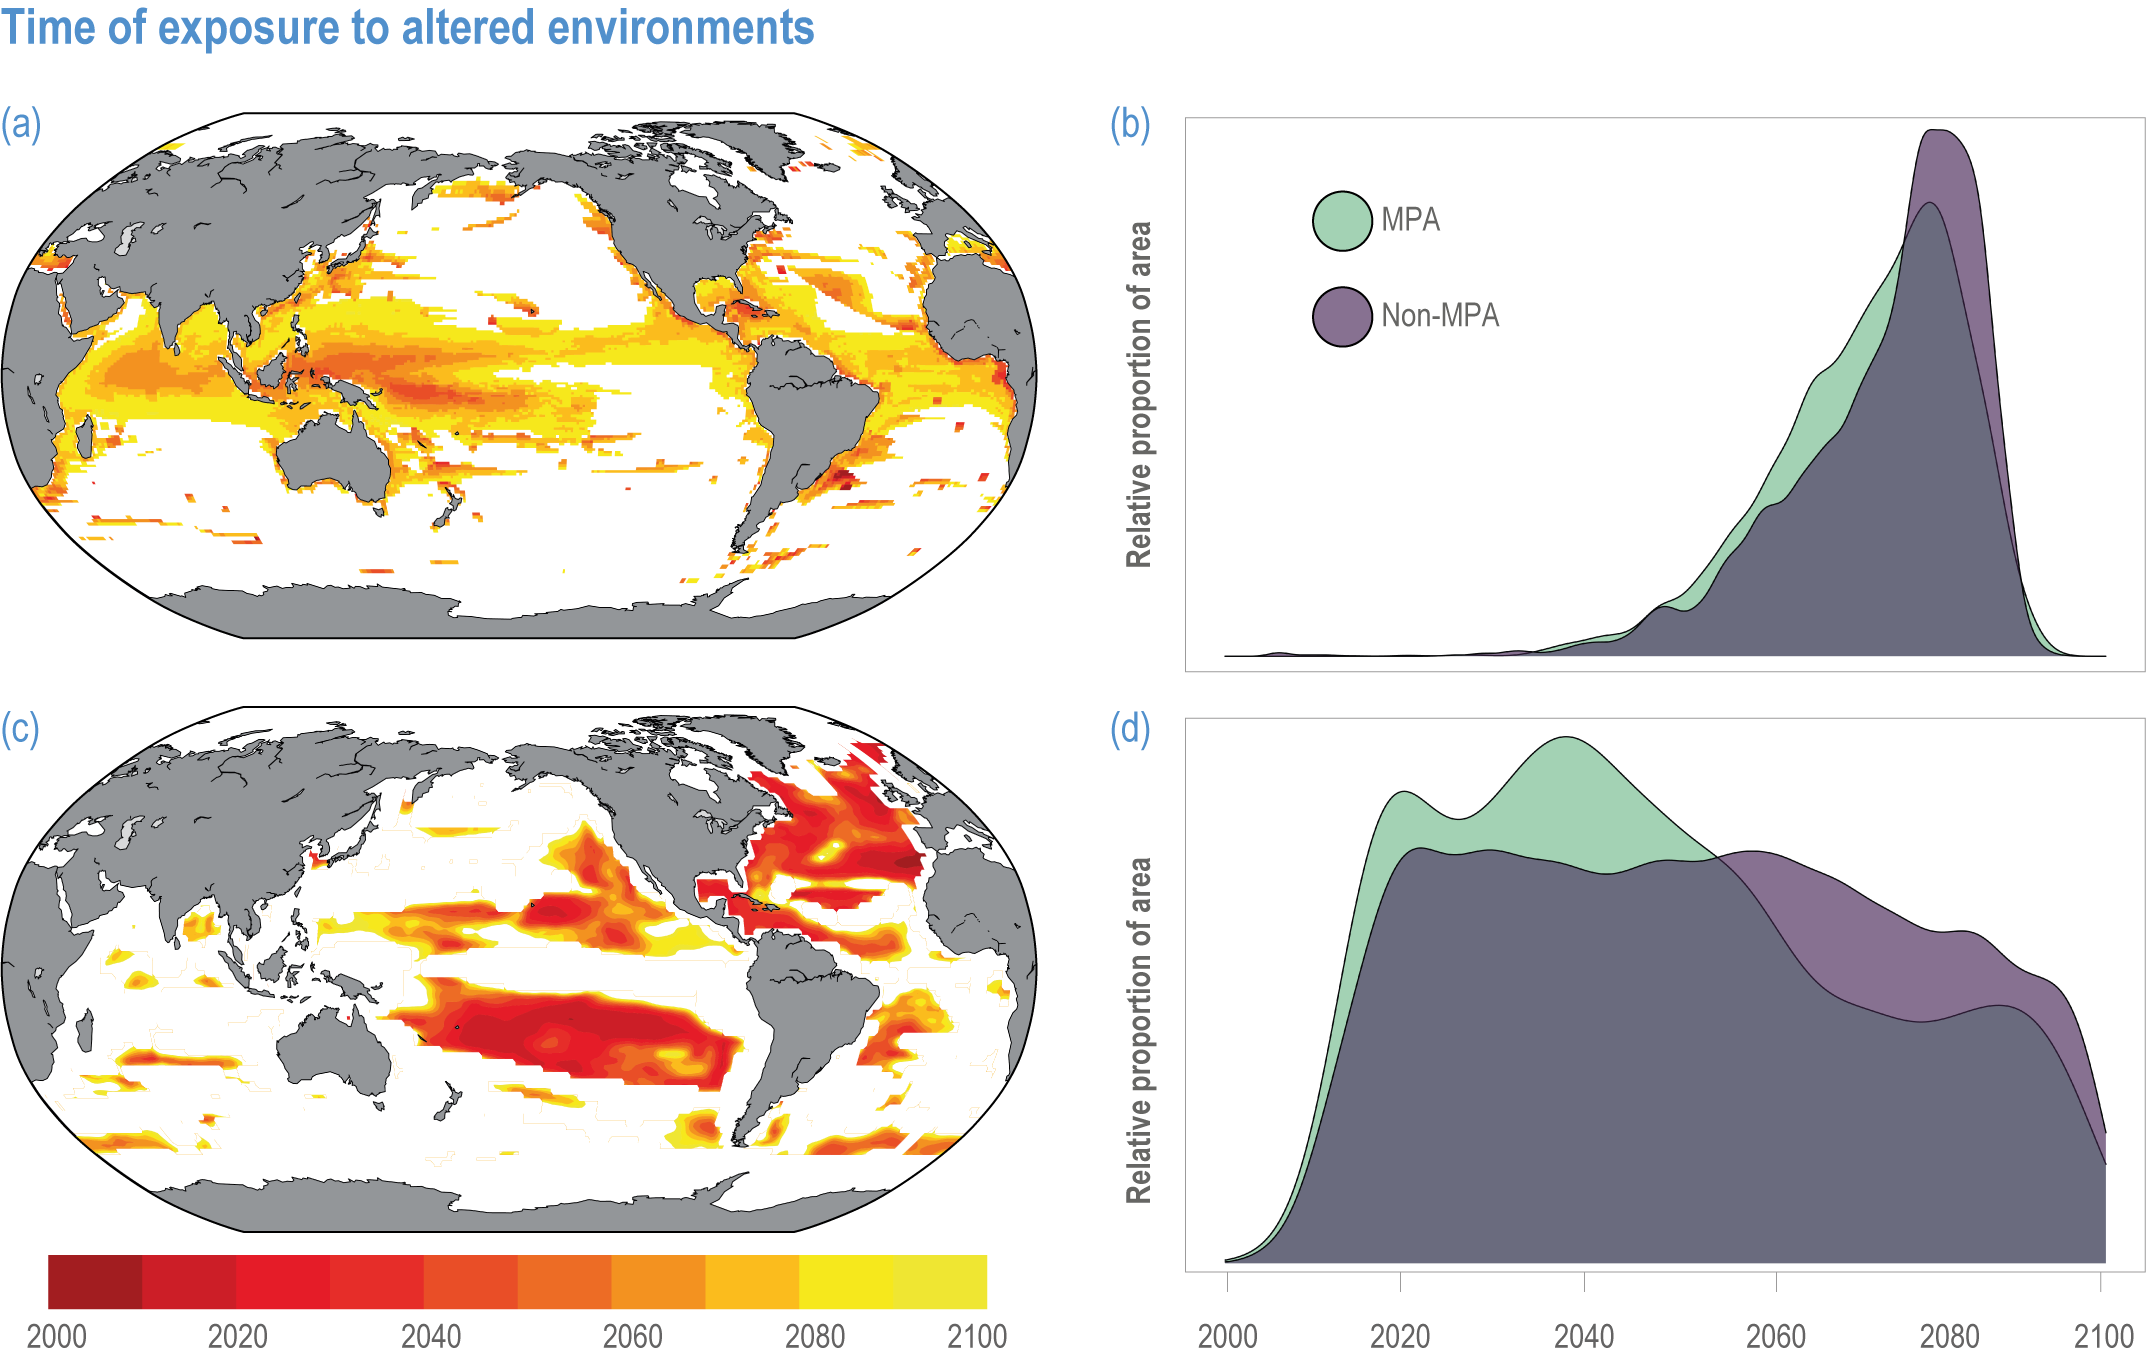
Figure caption
Figure 3.20 | Time of exposure to altered environments.
(a) Simulated spatial variation in the time of exposure of marine species to unprecedented temperatures under RCP8.5. Time of exposure is quantified as the median year after which local species are projected to encounter temperatures warmer than the historical maximum within their full geographic range for a period of at least 5 years. This estimate is based on 22 Coupled Model Intercomparison Project 5 (CMIP5) models, and is drawn from data presented by Trisos et al. (2020). Only regions that have times of emergence by 2100 are shown.
(b) The distribution in the time of exposure to unprecedented temperatures within marine assemblages (Trisos et al., 2020) under RCP8.5 in marine protected areas (in turquoise) and in non-marine protected areas (in purple). Values were calculated after regridding to equal-area 0.5° hexagons.
(c) Time of emergence for phytoplankton community-structure changes (based on a proxy–ecosystem-model reflectance at 500 nm) under RCP8.5. Only regions with statistically significant (p< 0.05) trends that are presently largely ice free and have times of emergence by 2100 are shown. (Based on the results of one numerical model from Dutkiewicz et al., 2019).
(d) The distribution in the time of emergence for changes in phytoplankton community structure (same proxy as in panel c) (Dutkiewicz et al., 2019) under RCP8.5 in marine protected areas (in turquoise) and in non-marine protected areas (in purple). Values were calculated after regridding to equal-area 0.5° hexagons.