Figure 4.8
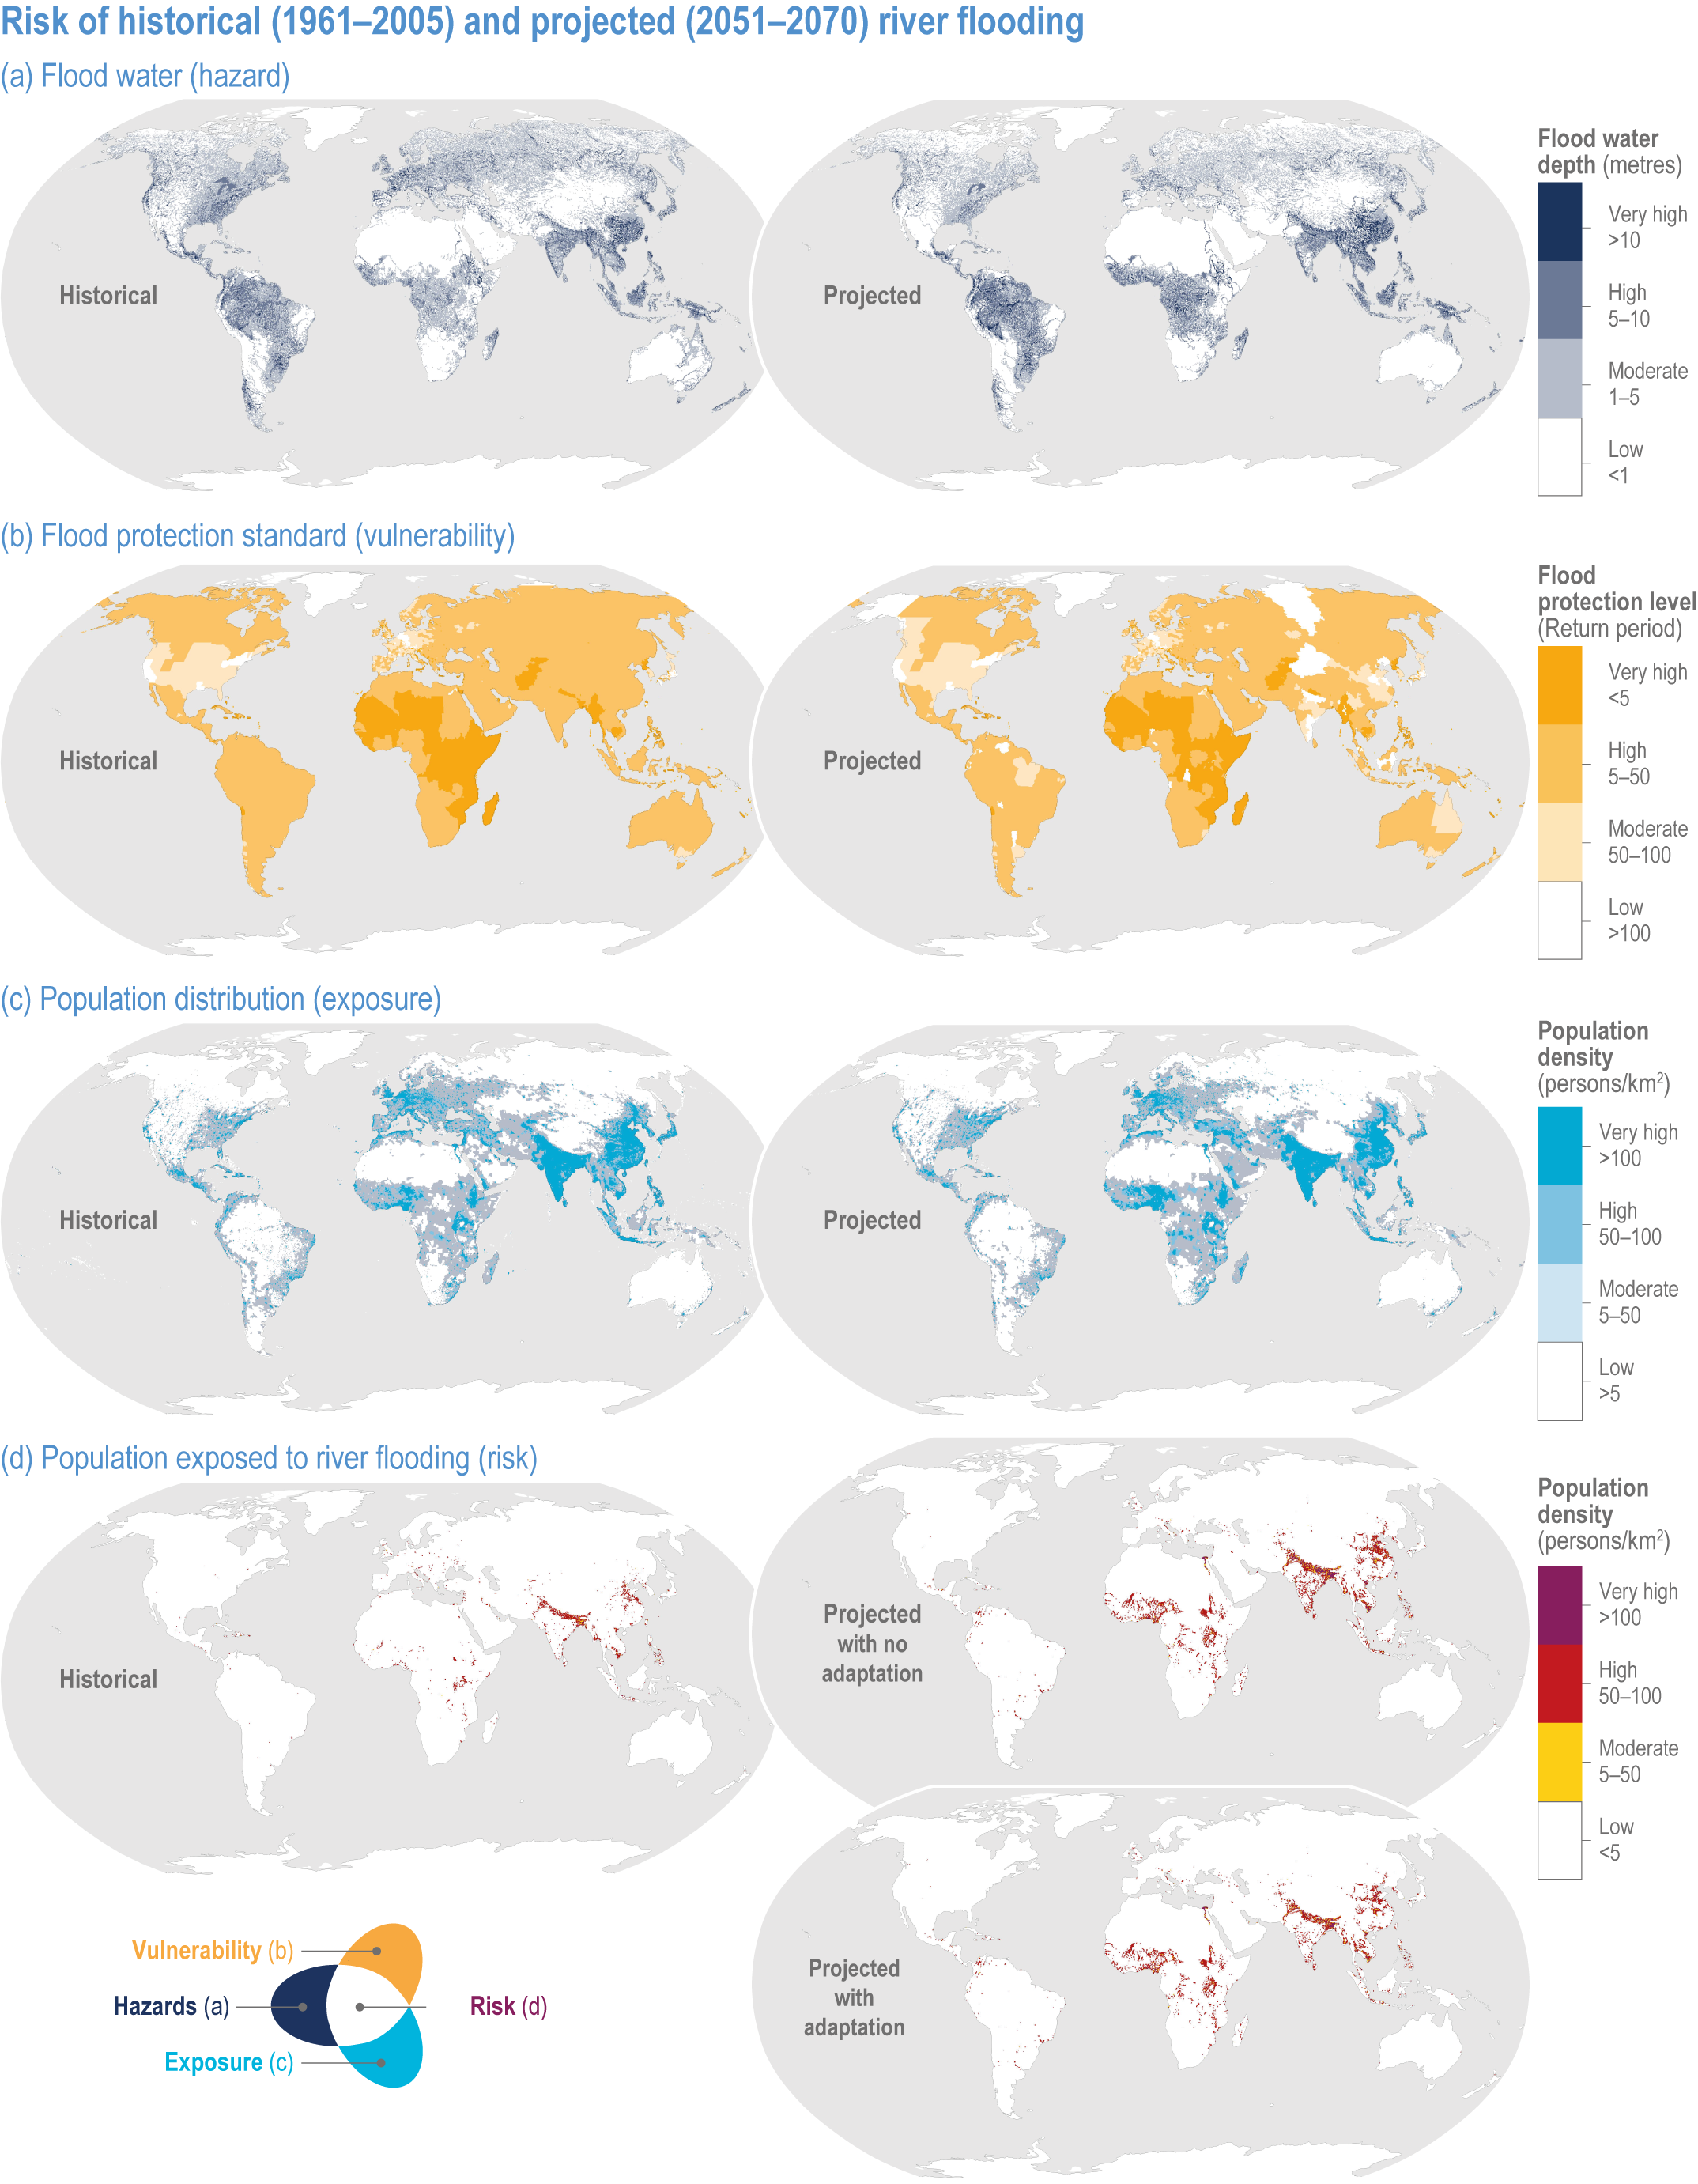
Figure caption
Figure 4.8 |
(a) Modelled mean global fluvial flood water depth (Tanoue et al., 2016; Tanoue et al., 2021) based on a land surface model and a river and inundation model driven by reanalysis climate forcing of five CMIP5 GCMs (metres). The annual maximum daily river water was allocated along elevations, and inundation depth was calculated for each year and averaged for the target period.
(b) Local flood protection standard (return period) at sub-country scale (Scussolini et al., 2016) based on published reports and documents, websites and personal communications with experts. Note that the vulnerability of this map reflects local flood protection such as complex infrastructure and does not fully reflect the other source of vulnerabilities, including exposure.
(c) Population distribution per 30 arc second grid cell (Klein Goldewijk et al., 2010; Klein Goldewijk et al., 2011).
(d) Population exposed to flood (number of people where inundation occurs) per 30 arc-second grid cell. Population under inundation depth > 0 m (a) was counted when the return period of annual maximum daily river water exceeds the flood protection standard (c) calculated by the authors. All values are averages for the period 1958–2010 for the past and 2050–2070 for the future.