Back chapter figures
Figure 5.11
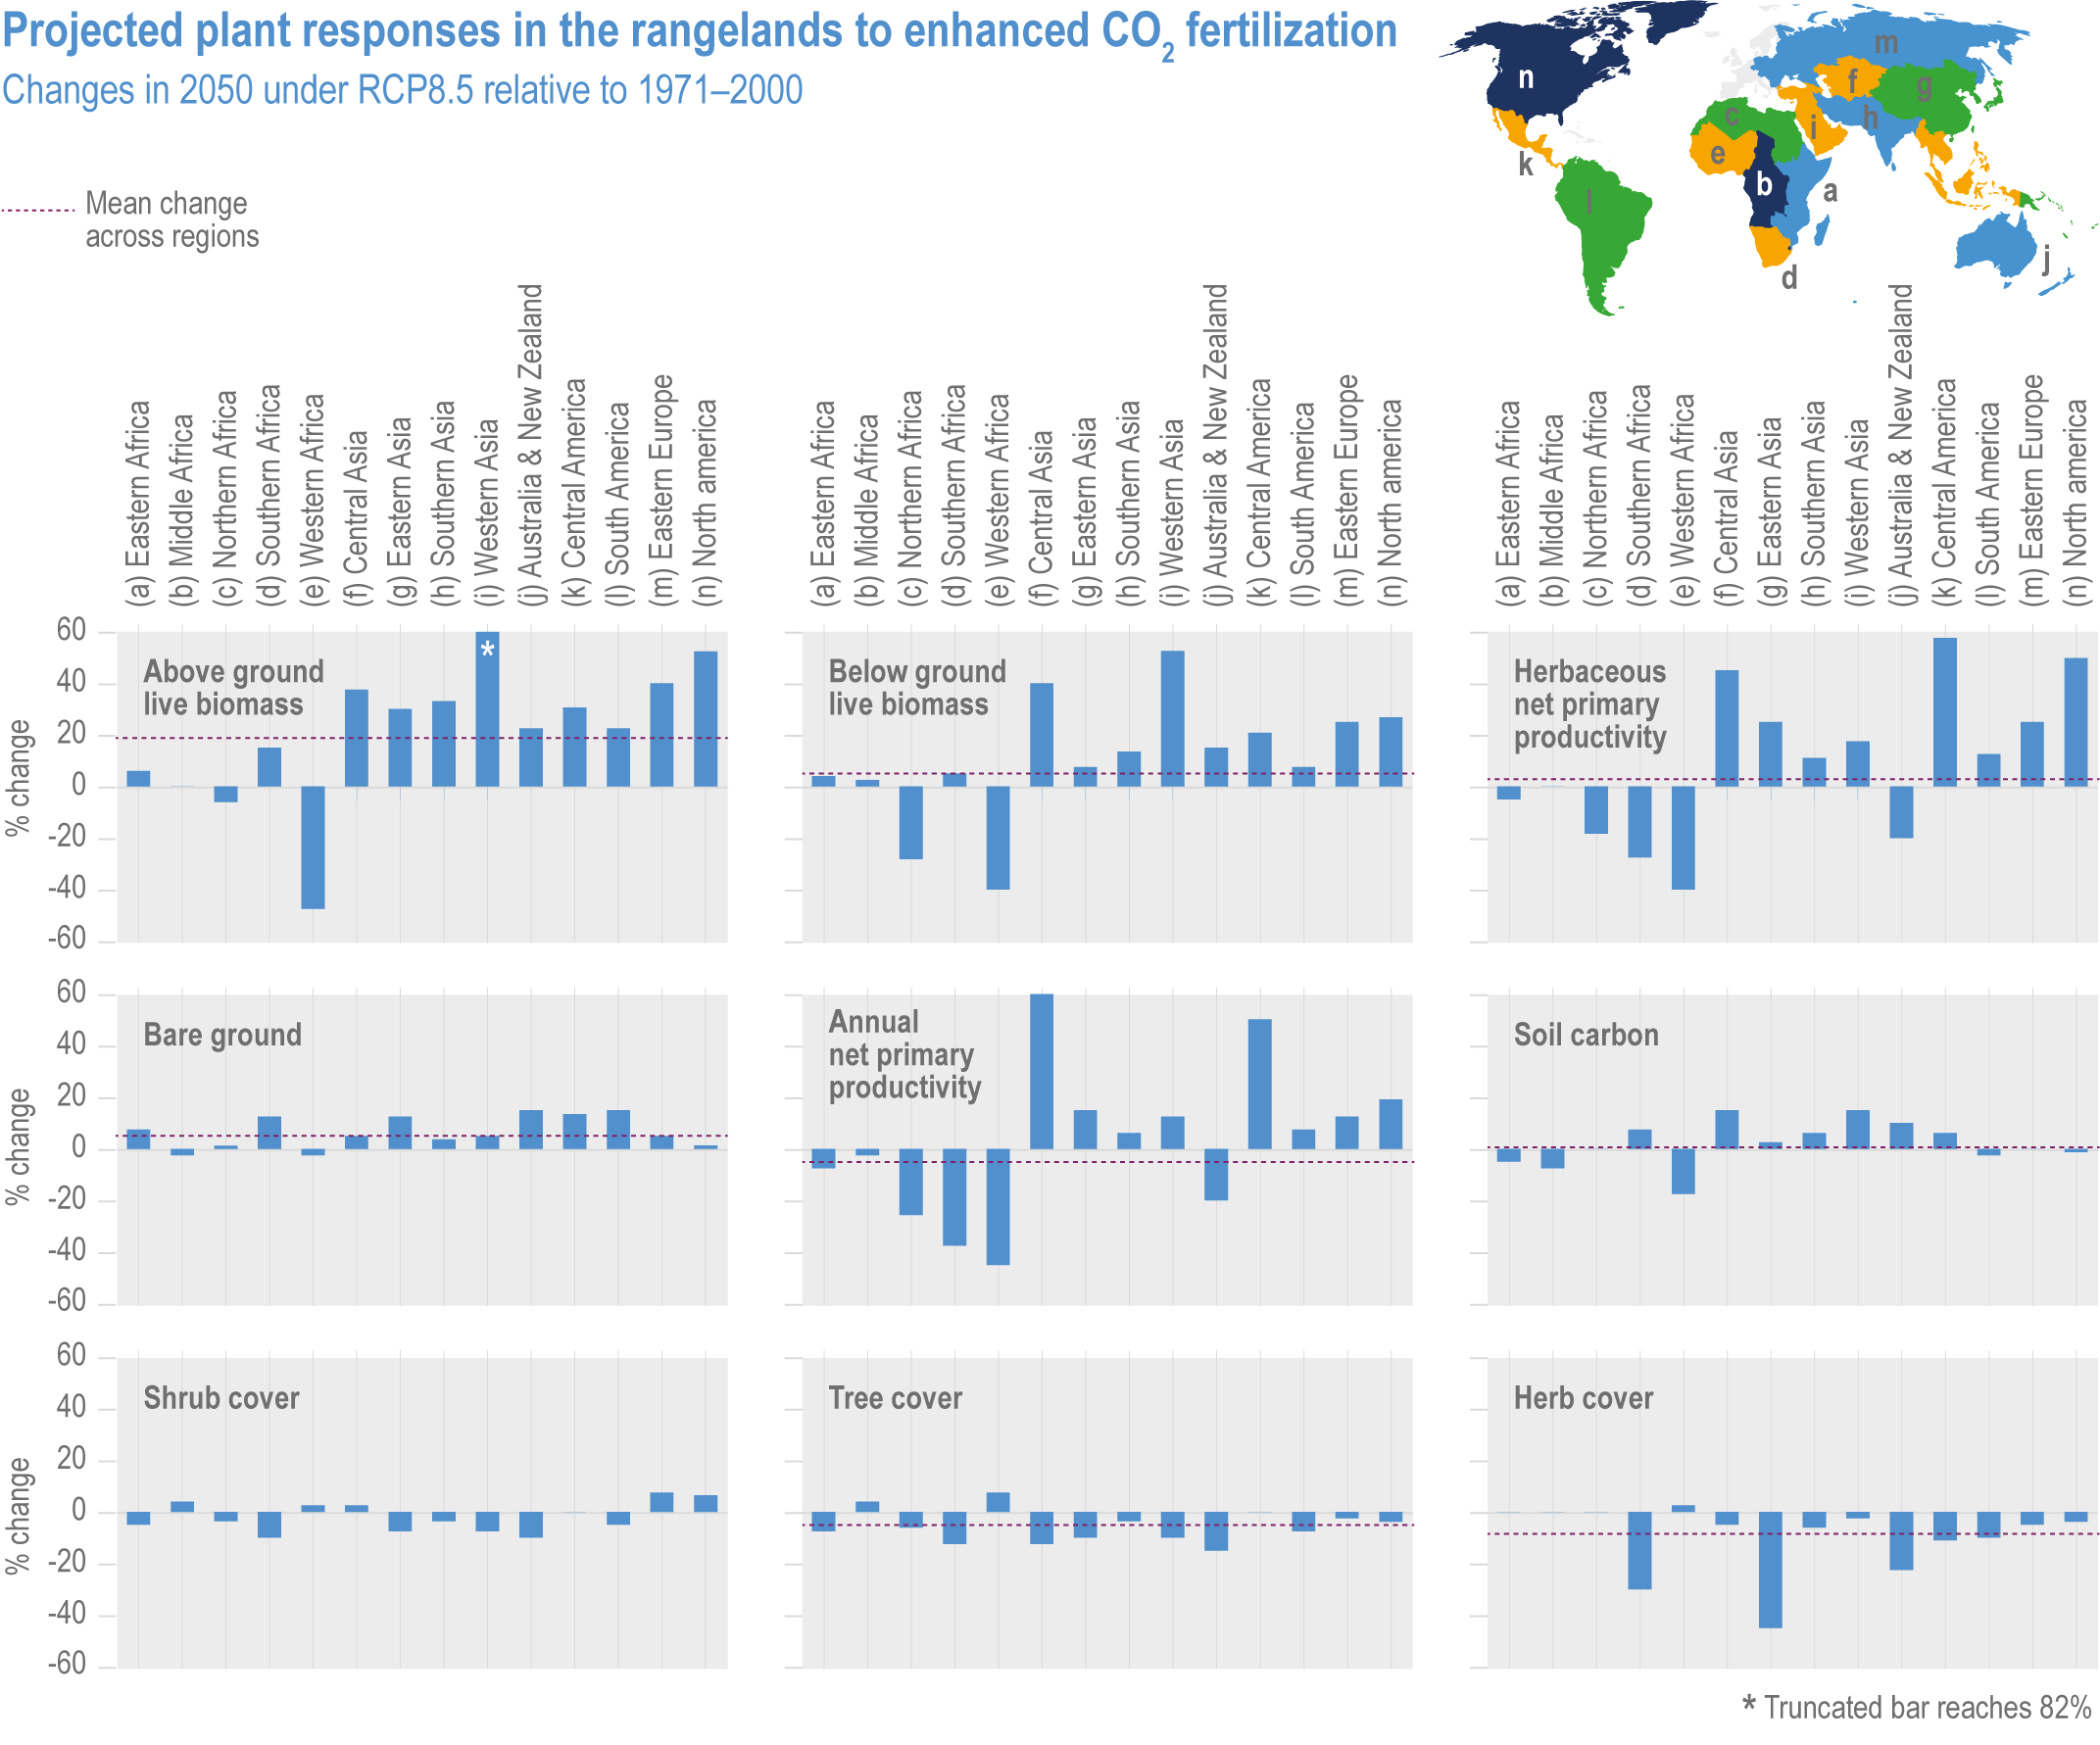
Figure caption
Figure 5.11 | Regional percent changes in land cover and soil carbon from ensemble simulation results in 2050 under emissions scenario RCP8.5 compared with 1971–2000. Plant responses were enhanced by CO2 fertilisation. The larger chart (lower left) shows mean changes for all rangelands, and all charts are scaled to −60% to +60% change. Shown are annual net primary productivity (ANPP), herbaceous net primary productivity (HNPP), bare ground, herbaceous (herb), shrub, and tree cover, SOC (soil carbon), above-ground live biomass and below-ground live biomass. Regions as defined by the United Nations Statistics Division. The bar for above-ground live biomass in Western Asia (*) is truncated and is 82% (Boone et al., 2018).