Figure 9.2
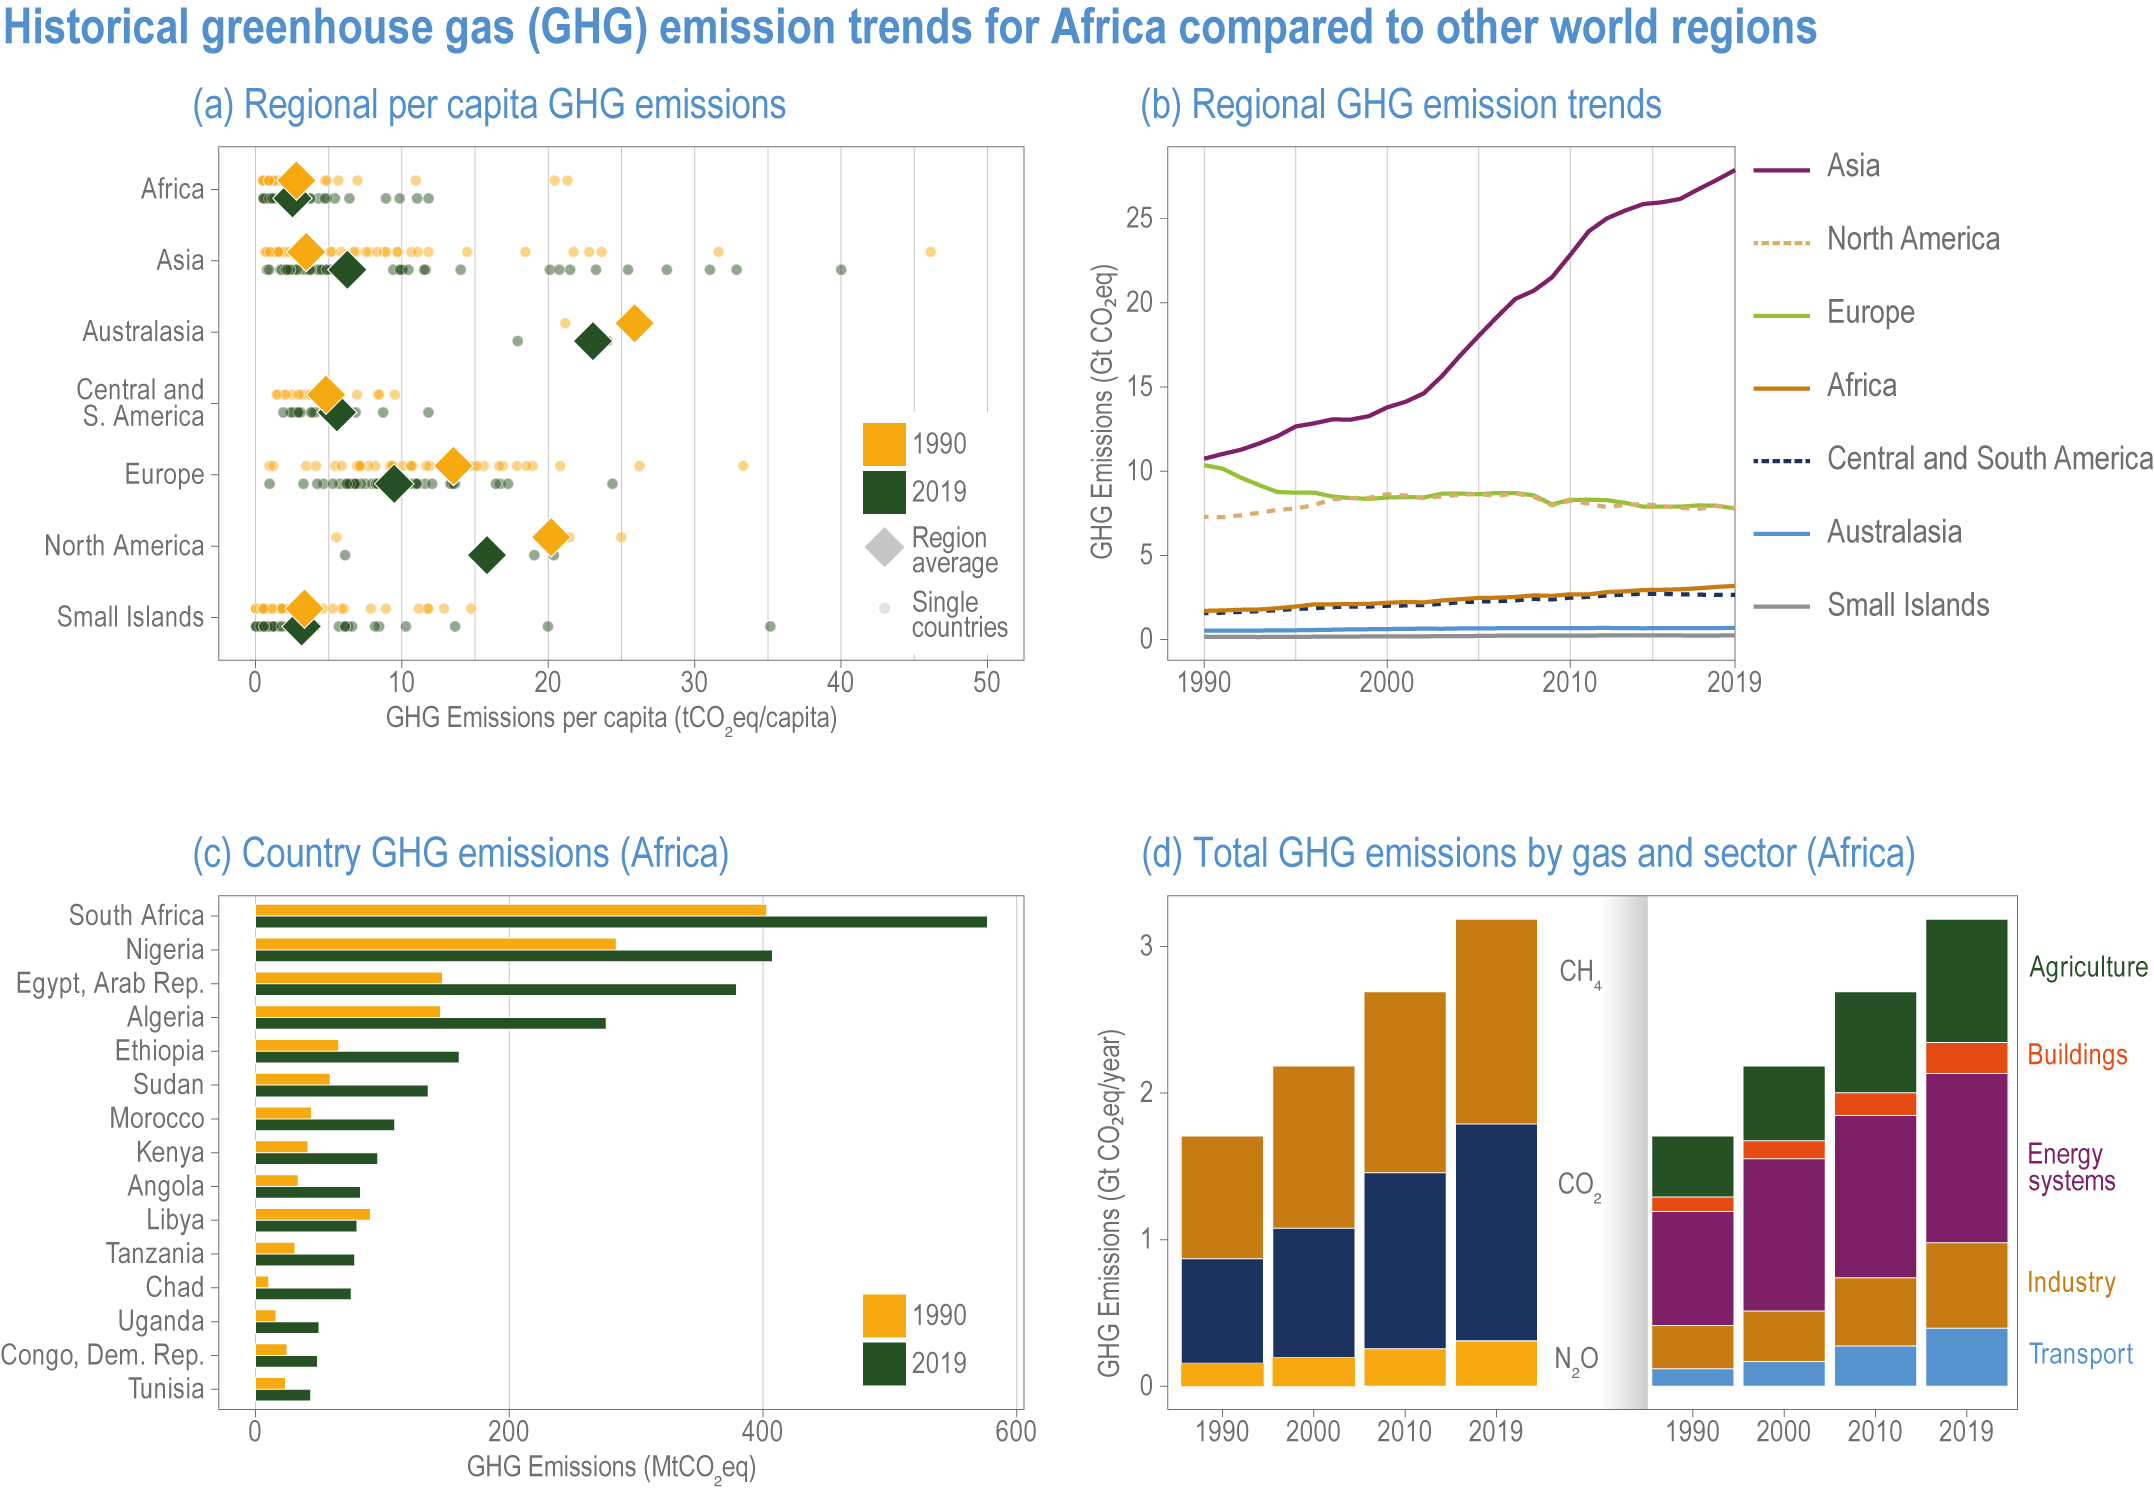
Figure caption
Figure 9.2 | Historical greenhouse gas (GHG) emission trends for Africa compared to other world regions:
(a) Per person GHG emissions by region and their change from 1990 to 2019 (circles represent countries, diamonds represent the region average).
(b) Total GHG emissions by region since 1990.
(c) The total GHG emissions in 1990 and 2019 for the 15 highest emitting countries within Africa.
(d) Total emissions in Africa since 1990, broken down by GHG (left) and sector (right). Methane and CO2 emissions comprise an almost equal share of GHG emissions in Africa, with the largest emissions sectors being energy and agriculture (Crippa et al., 2021). Agriculture emissions in panel (d) do not include land use, land use change and forestry (LULUCF CO2). One-hundred-year global warming potentials consistent with WGI estimates are used. Emissions data are from Crippa et al. (2021), compiled in Working Group III (WGIII) Chapter 2.