Back chapter figures
Figure CCP1.3
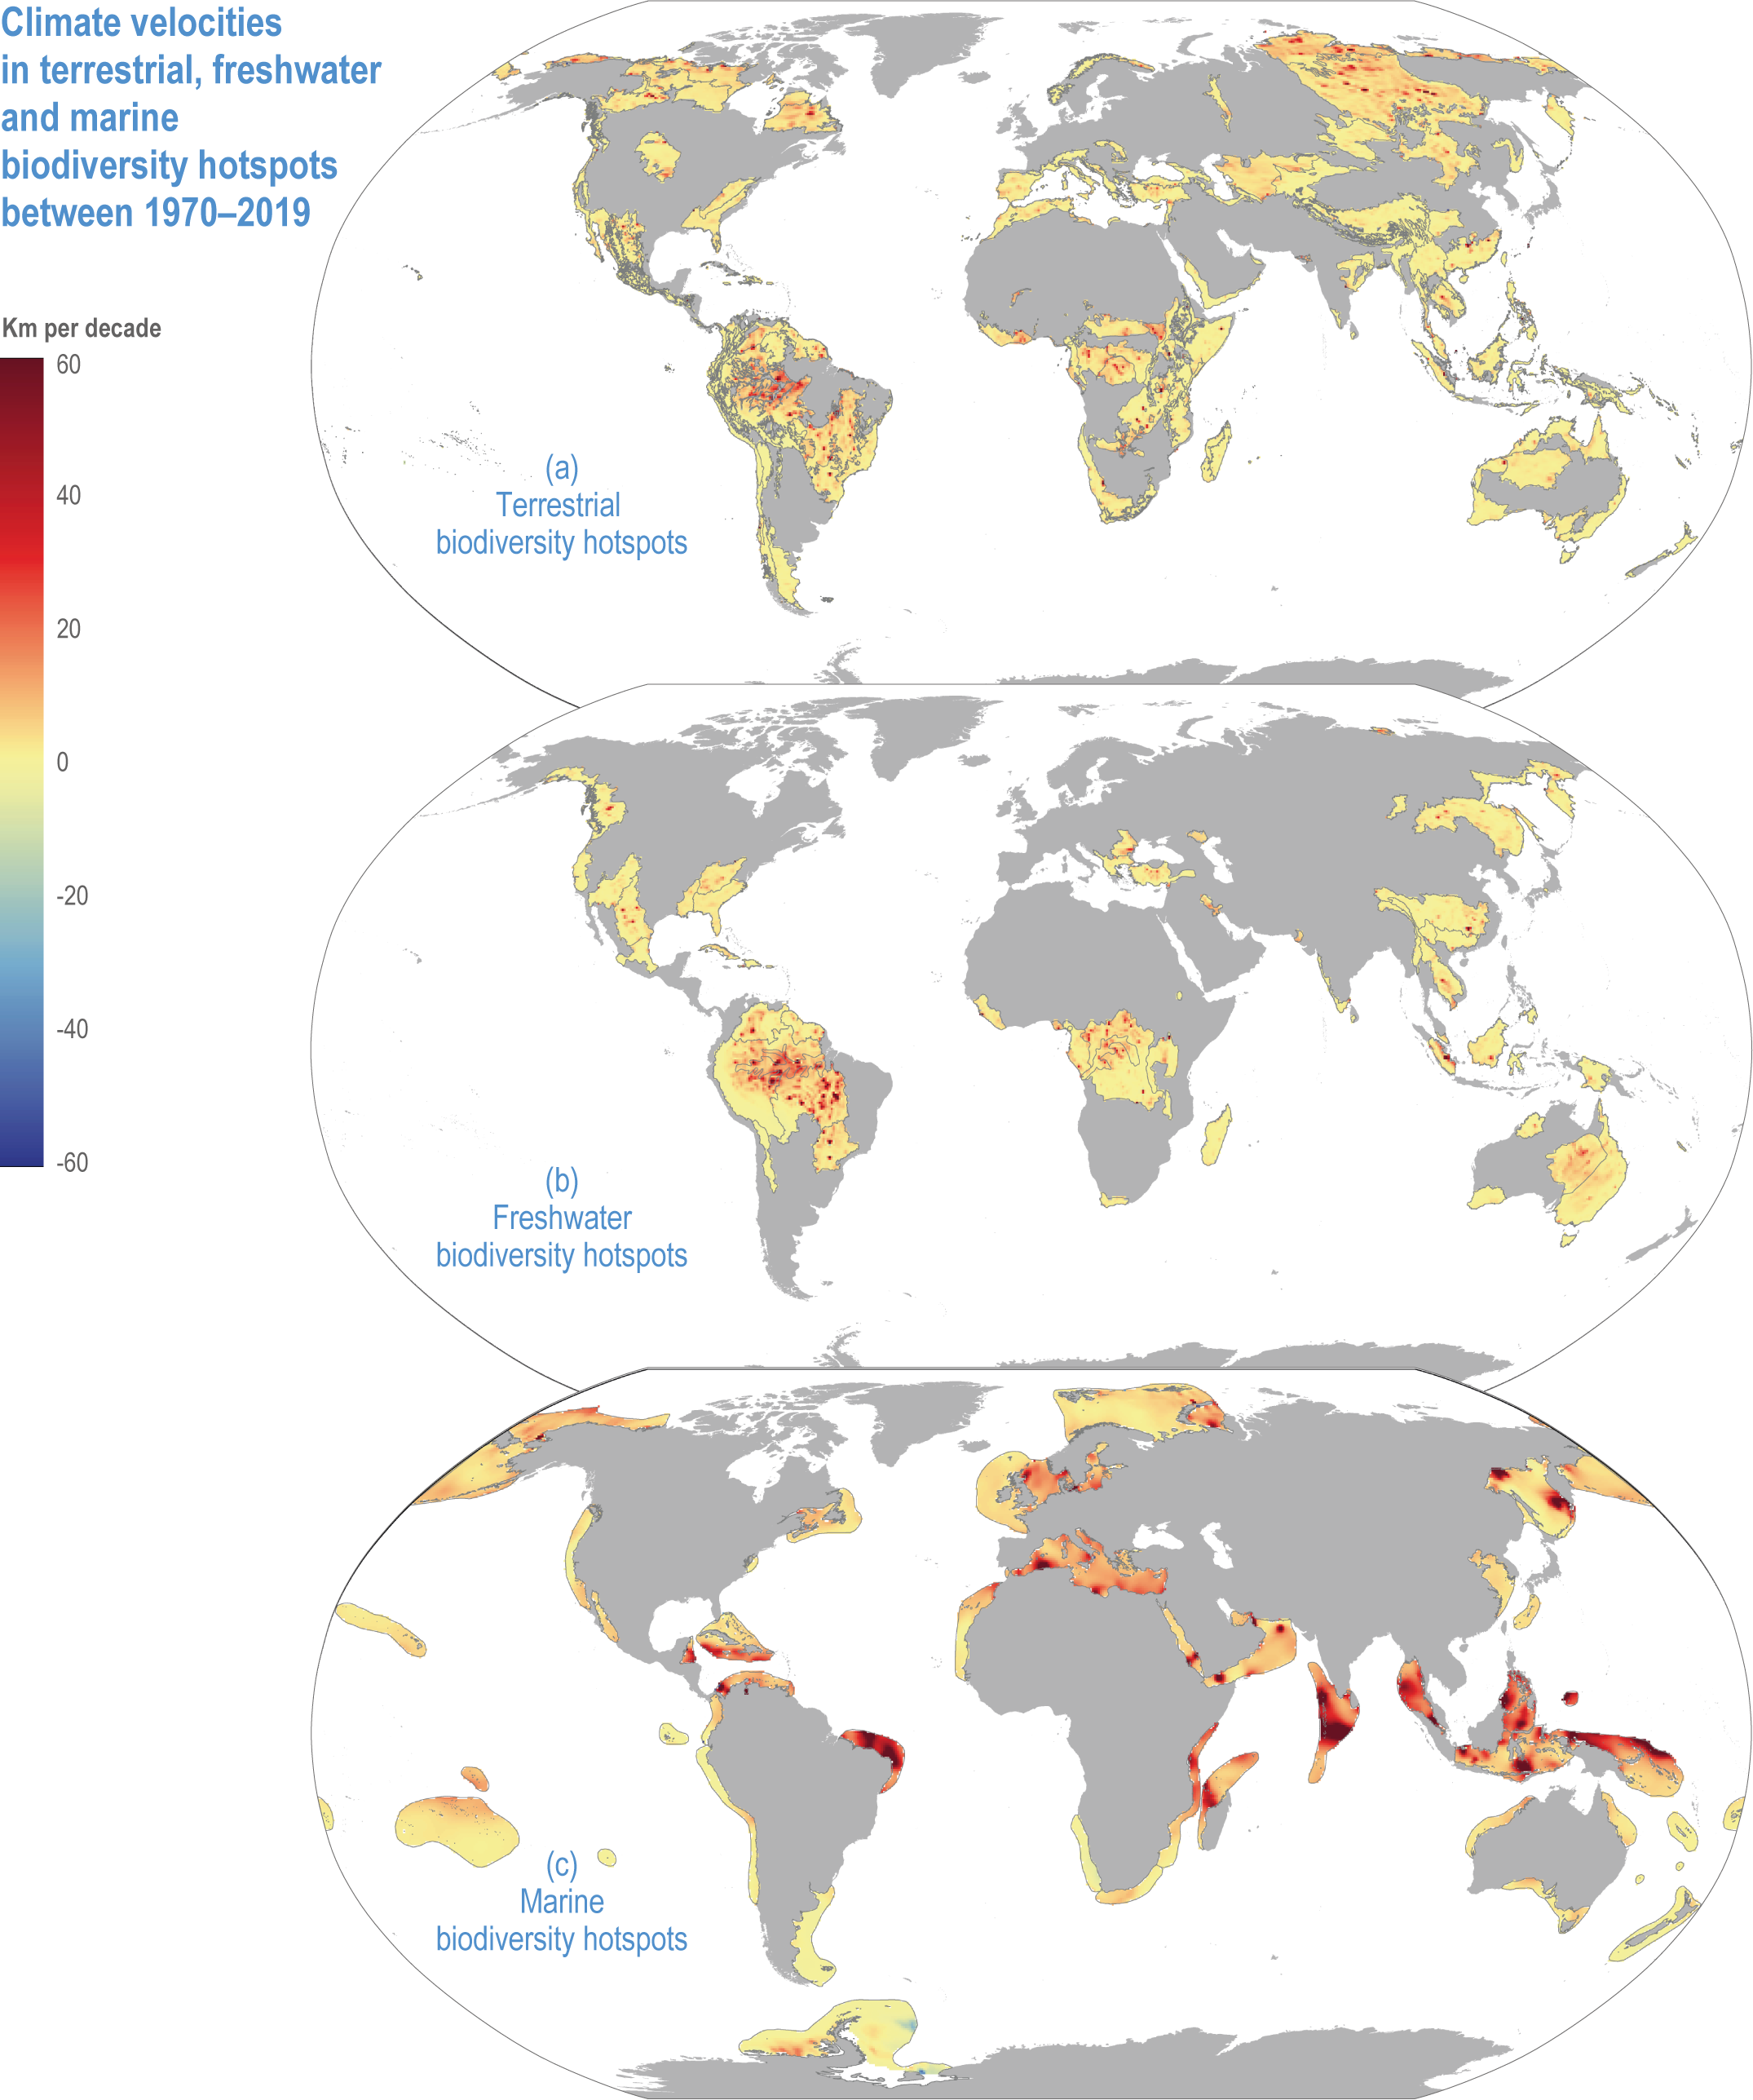
Figure caption
Figure CCP1.3 | Climate velocities in terrestrial (a), freshwater (b) and marine (c) hotspots between 1970–2019. Values are presented in kilometres per decade and derived using the analytical package VoCC (García Molinos et al., 2019) from gridded temperature data, sea surface temperatures for marine (Rayner et al., 2003) and near-surface air temperatures on land and freshwater (Harris et al., 2020). Positive and negative velocities indicate warming and cooling, respectively.