Back chapter figures
Figure CCP1.4
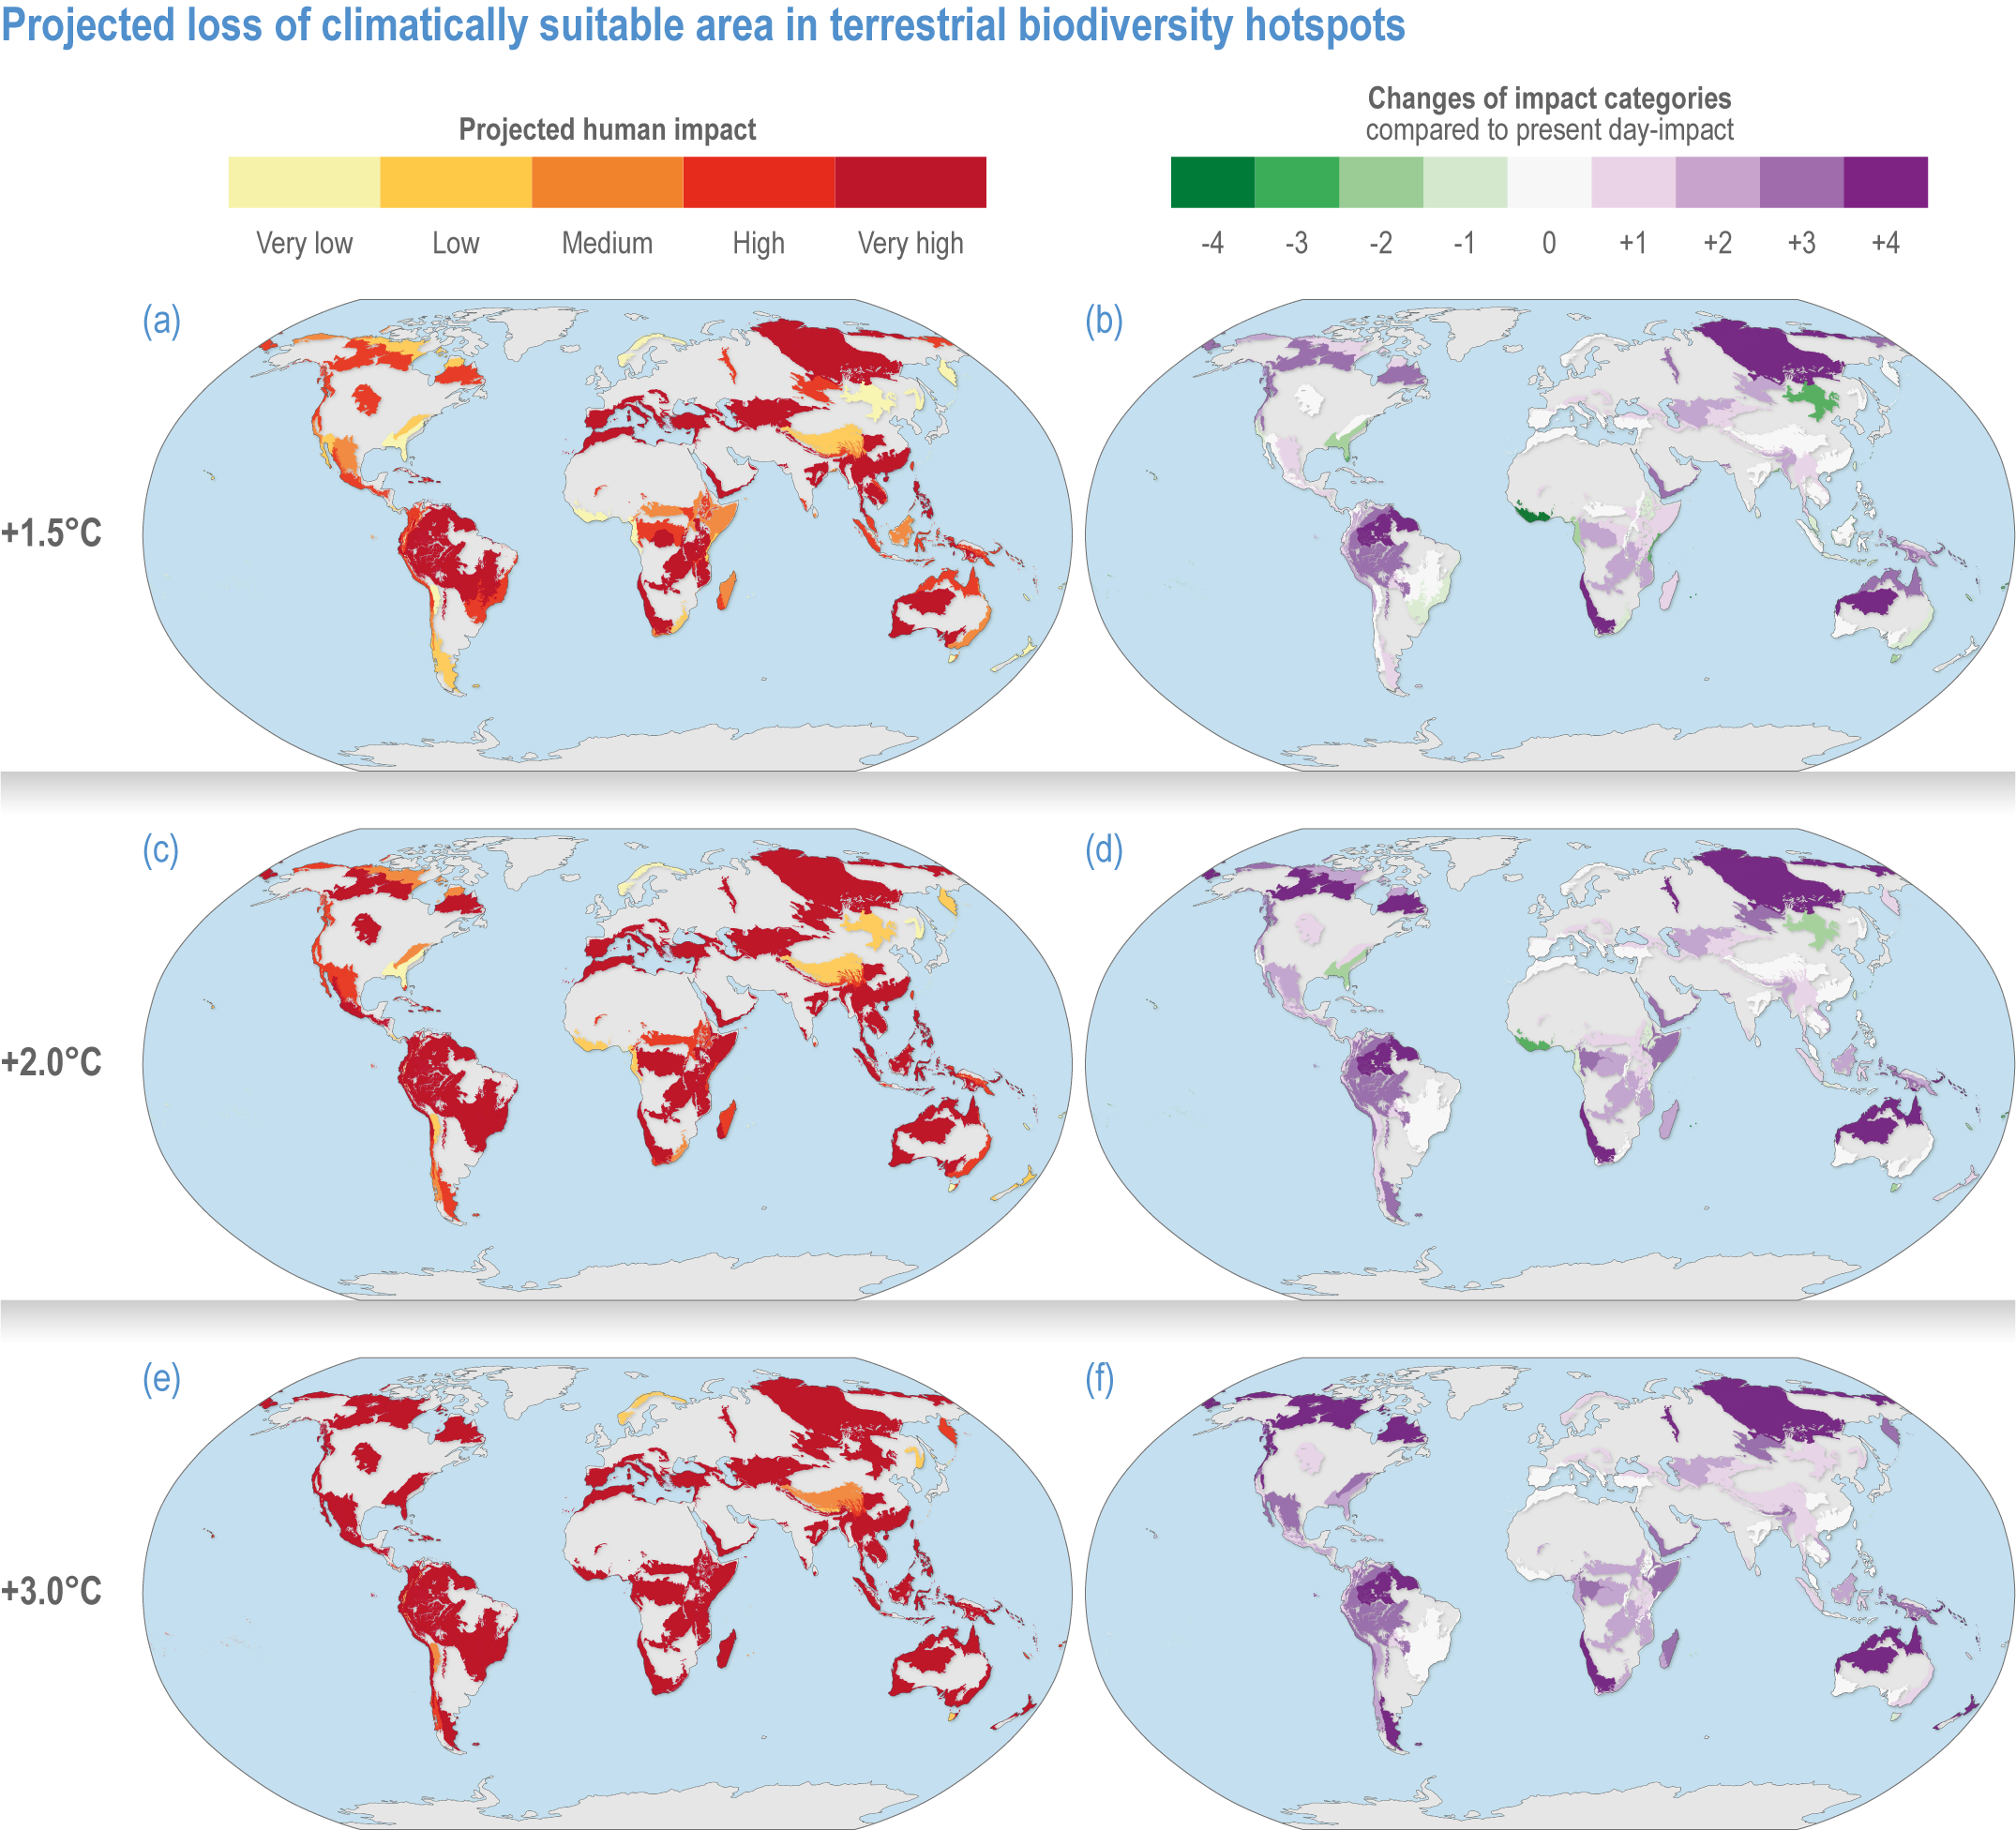
Figure caption
Figure CCP1.4 | Projected loss of climatically suitable area in terrestrial biodiversity hotspots for a global average of 1.5°C (upper row, a–b), 2°C (middle, c–d) and 3°C (lower, e–f). Left-hand column displays the projected human impact using the five equal 20% categories of present-day impact (Figure CCP1.1). The right-hand column indicates the changes of impact categories compared to present-day impact. See Table SMCCP1.1 for more details.