Back chapter figures
Figure CCP4.2
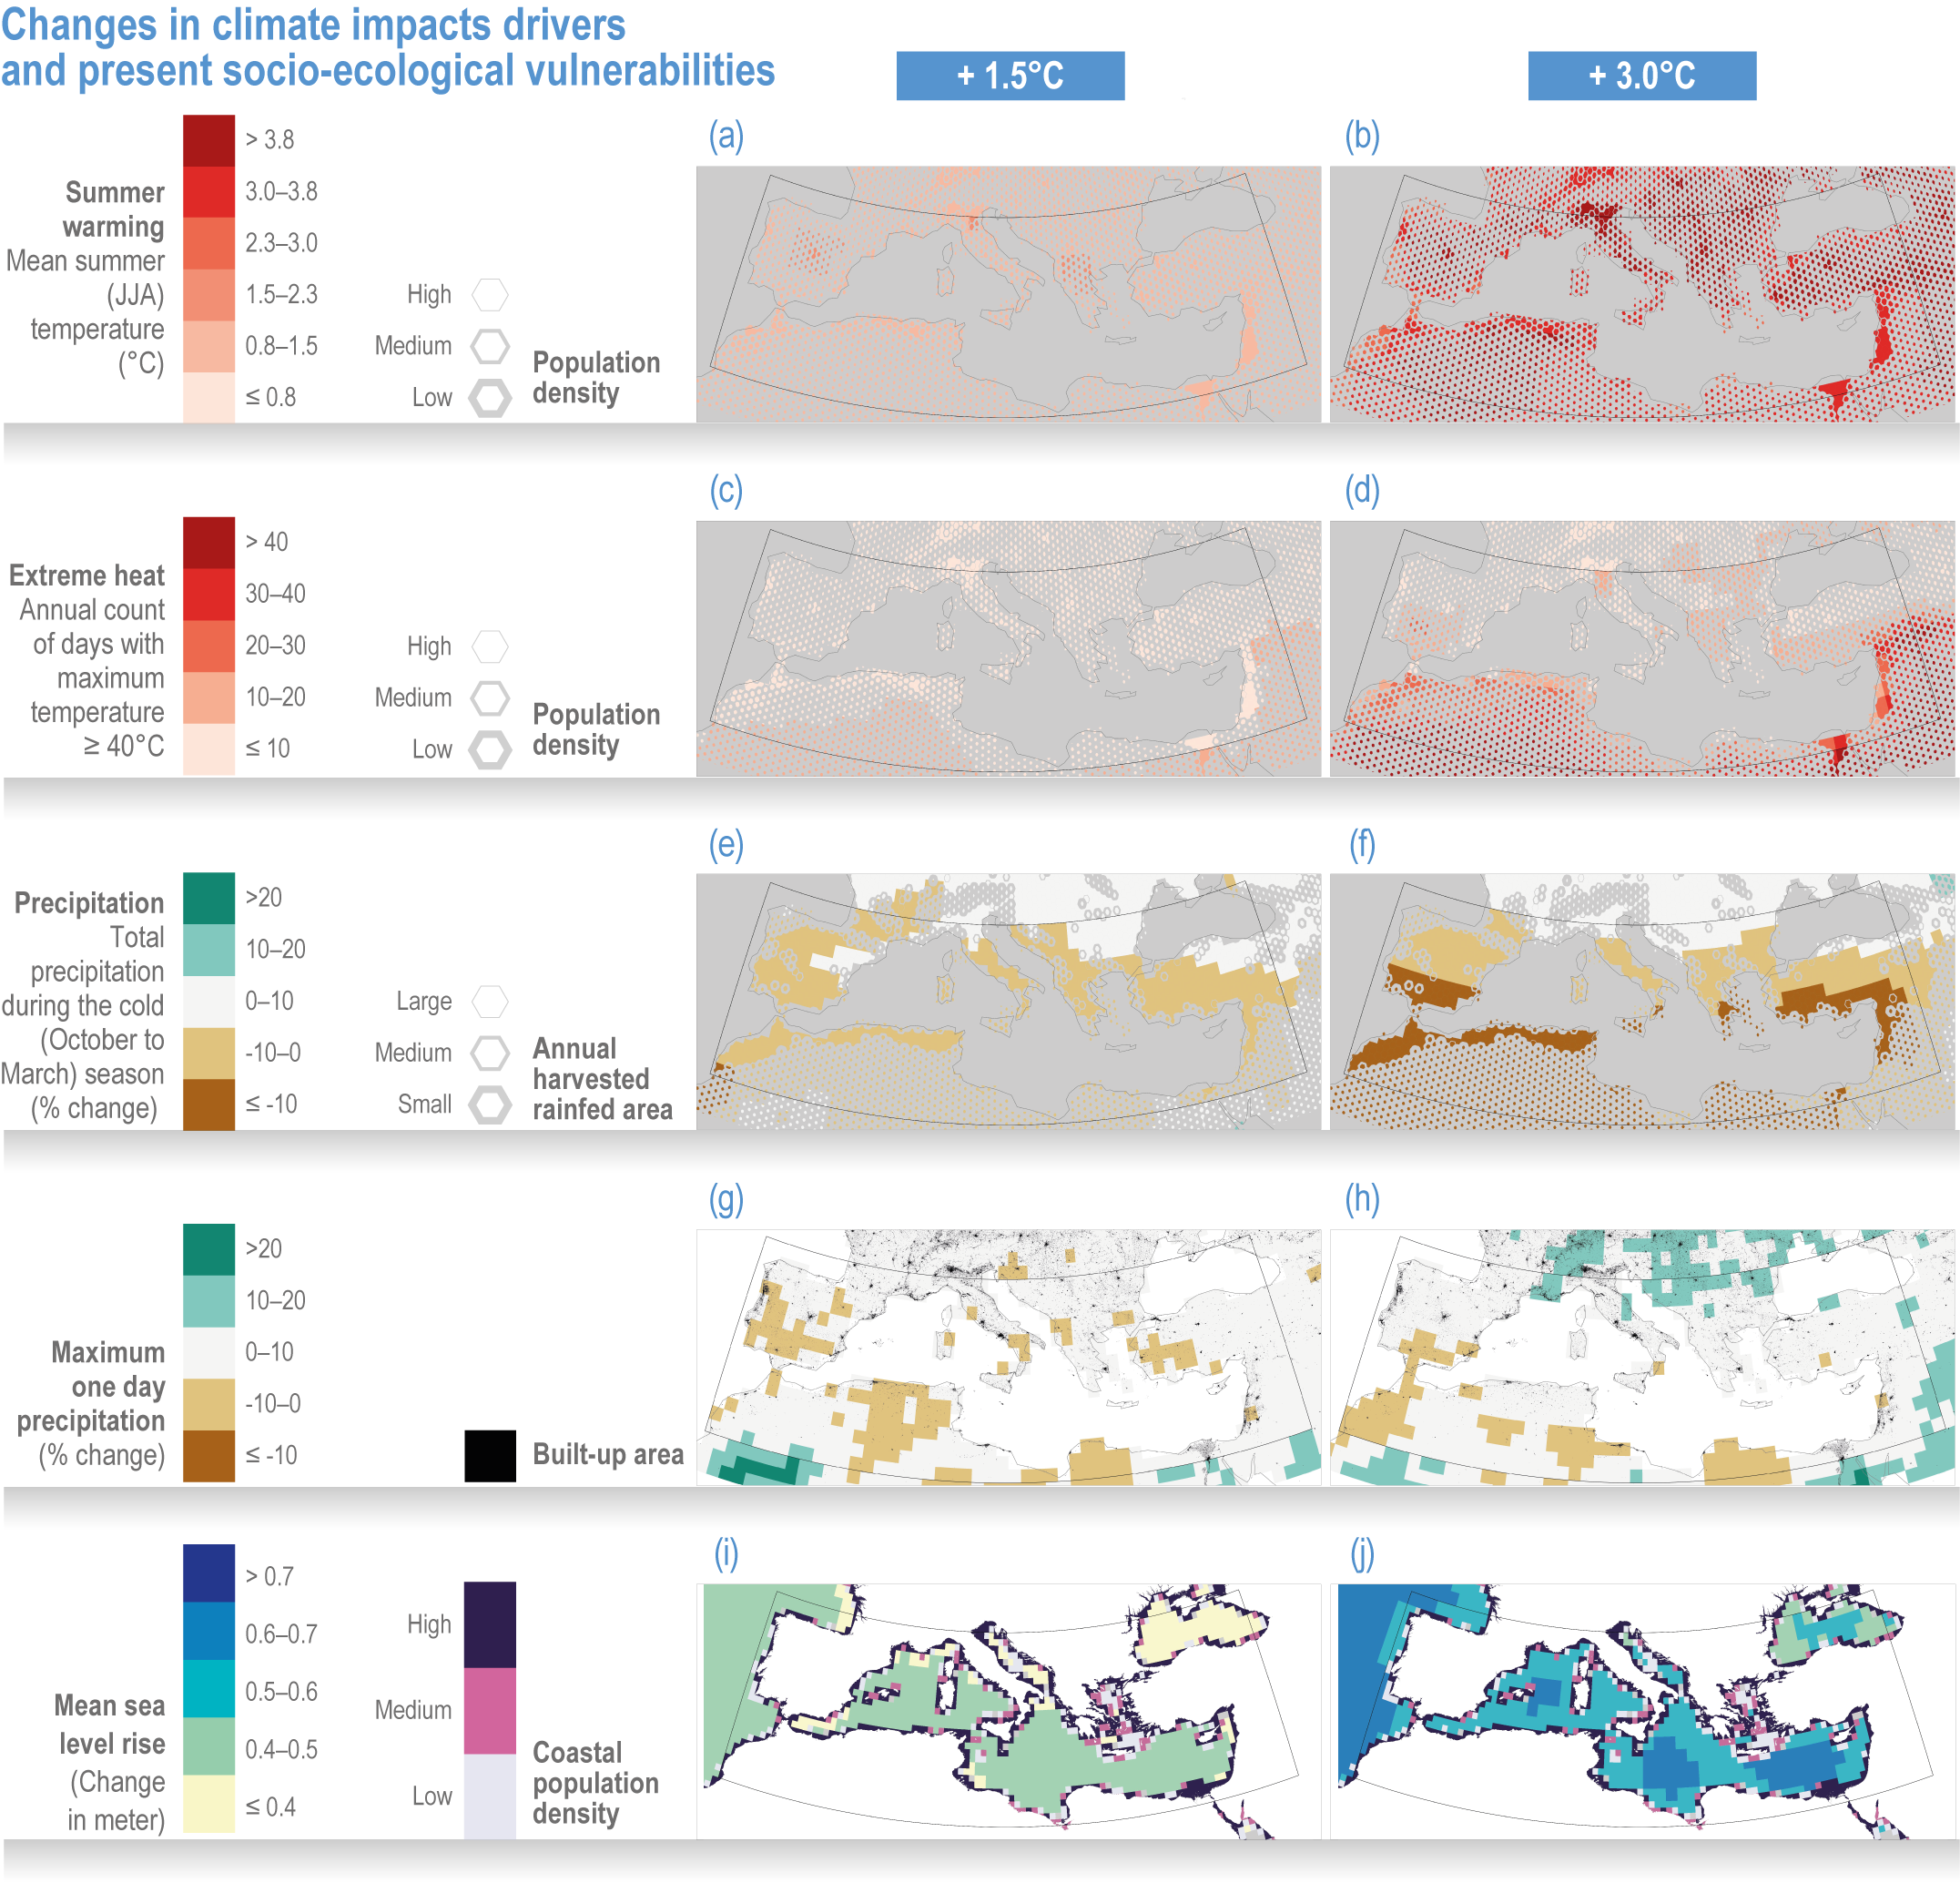
Figure caption
Figure CCP4.2 | Changes in climate impact drivers with respect to the 1995–2014 period for 1.5°C (left column) and 3°C (right column) global warming: mean summer (June to August) temperature (°C, a, b), number of days with maximum temperature above 40°C (days, c, d), total precipitation during the cold (October to March) season (%, e, f) and 1-day maximum precipitation (mm, g, h). Values based on CMIP6 global projections and SSP5-8.5. Sea level rise concerns the long term (2081–2100) and SSP1-2.6 for (i) and SSP3-7.0 for (j) (source: Annex I: Atlas).