Figure TS.5 ECOSYSTEMS
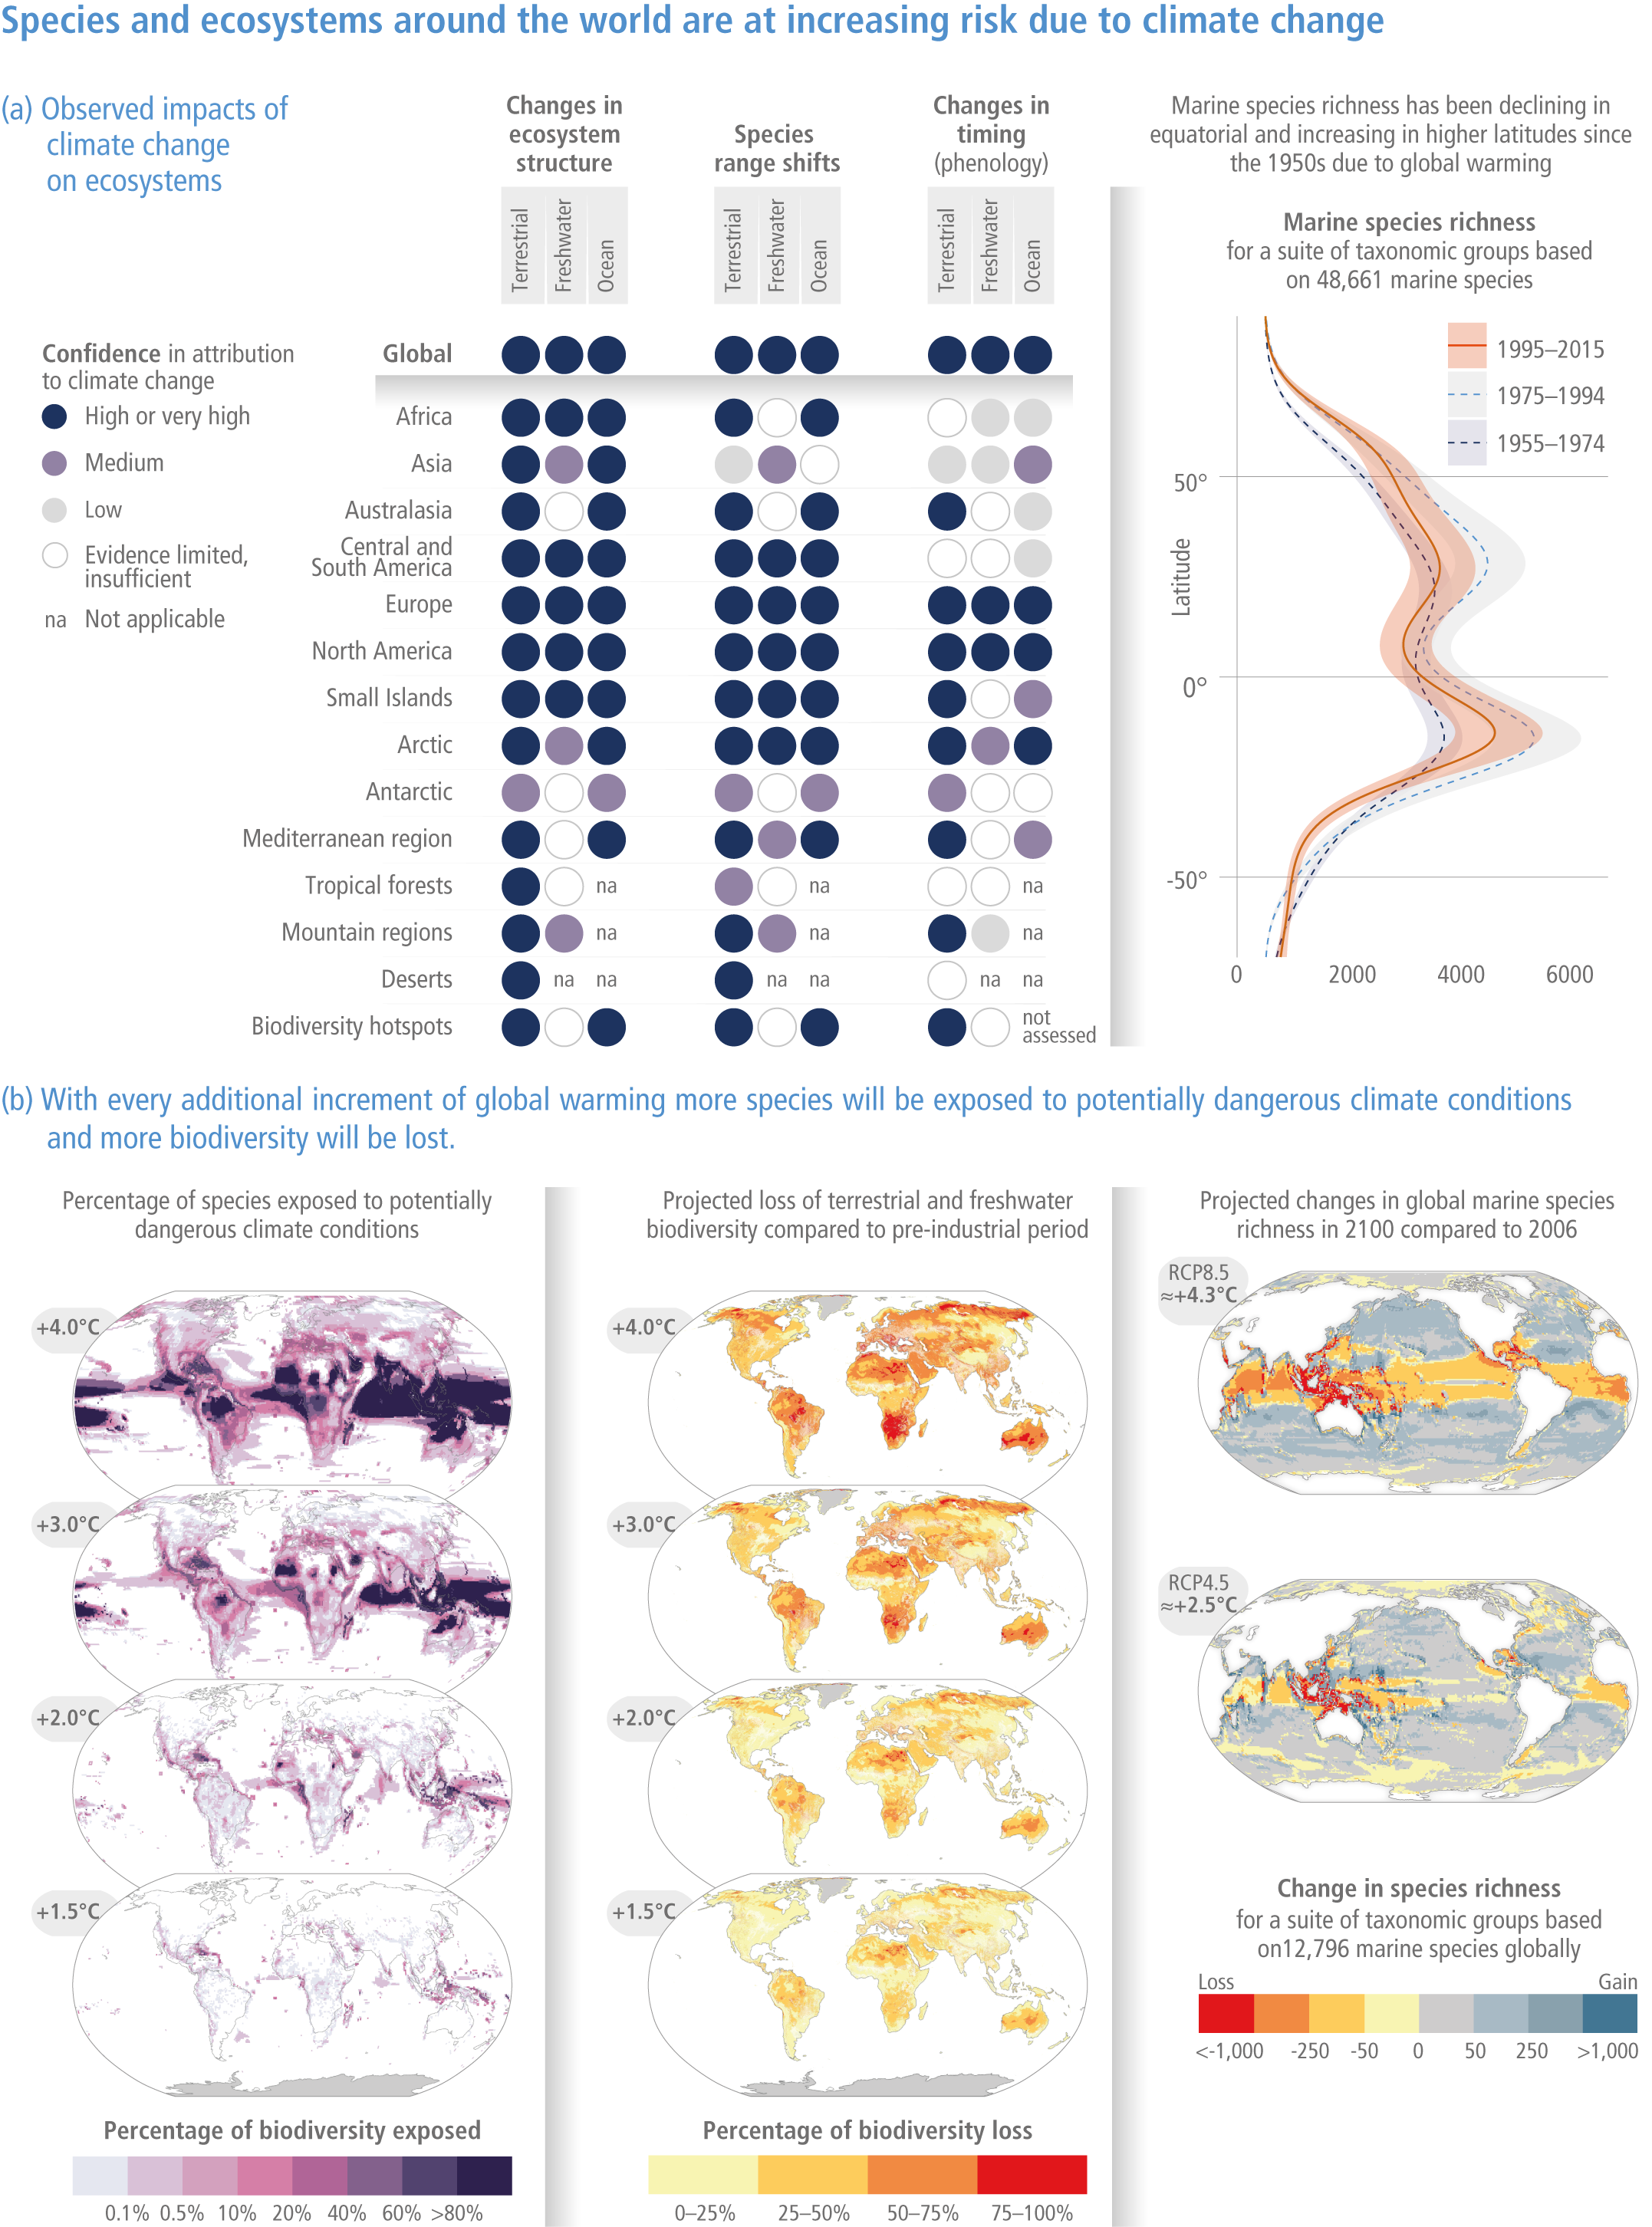
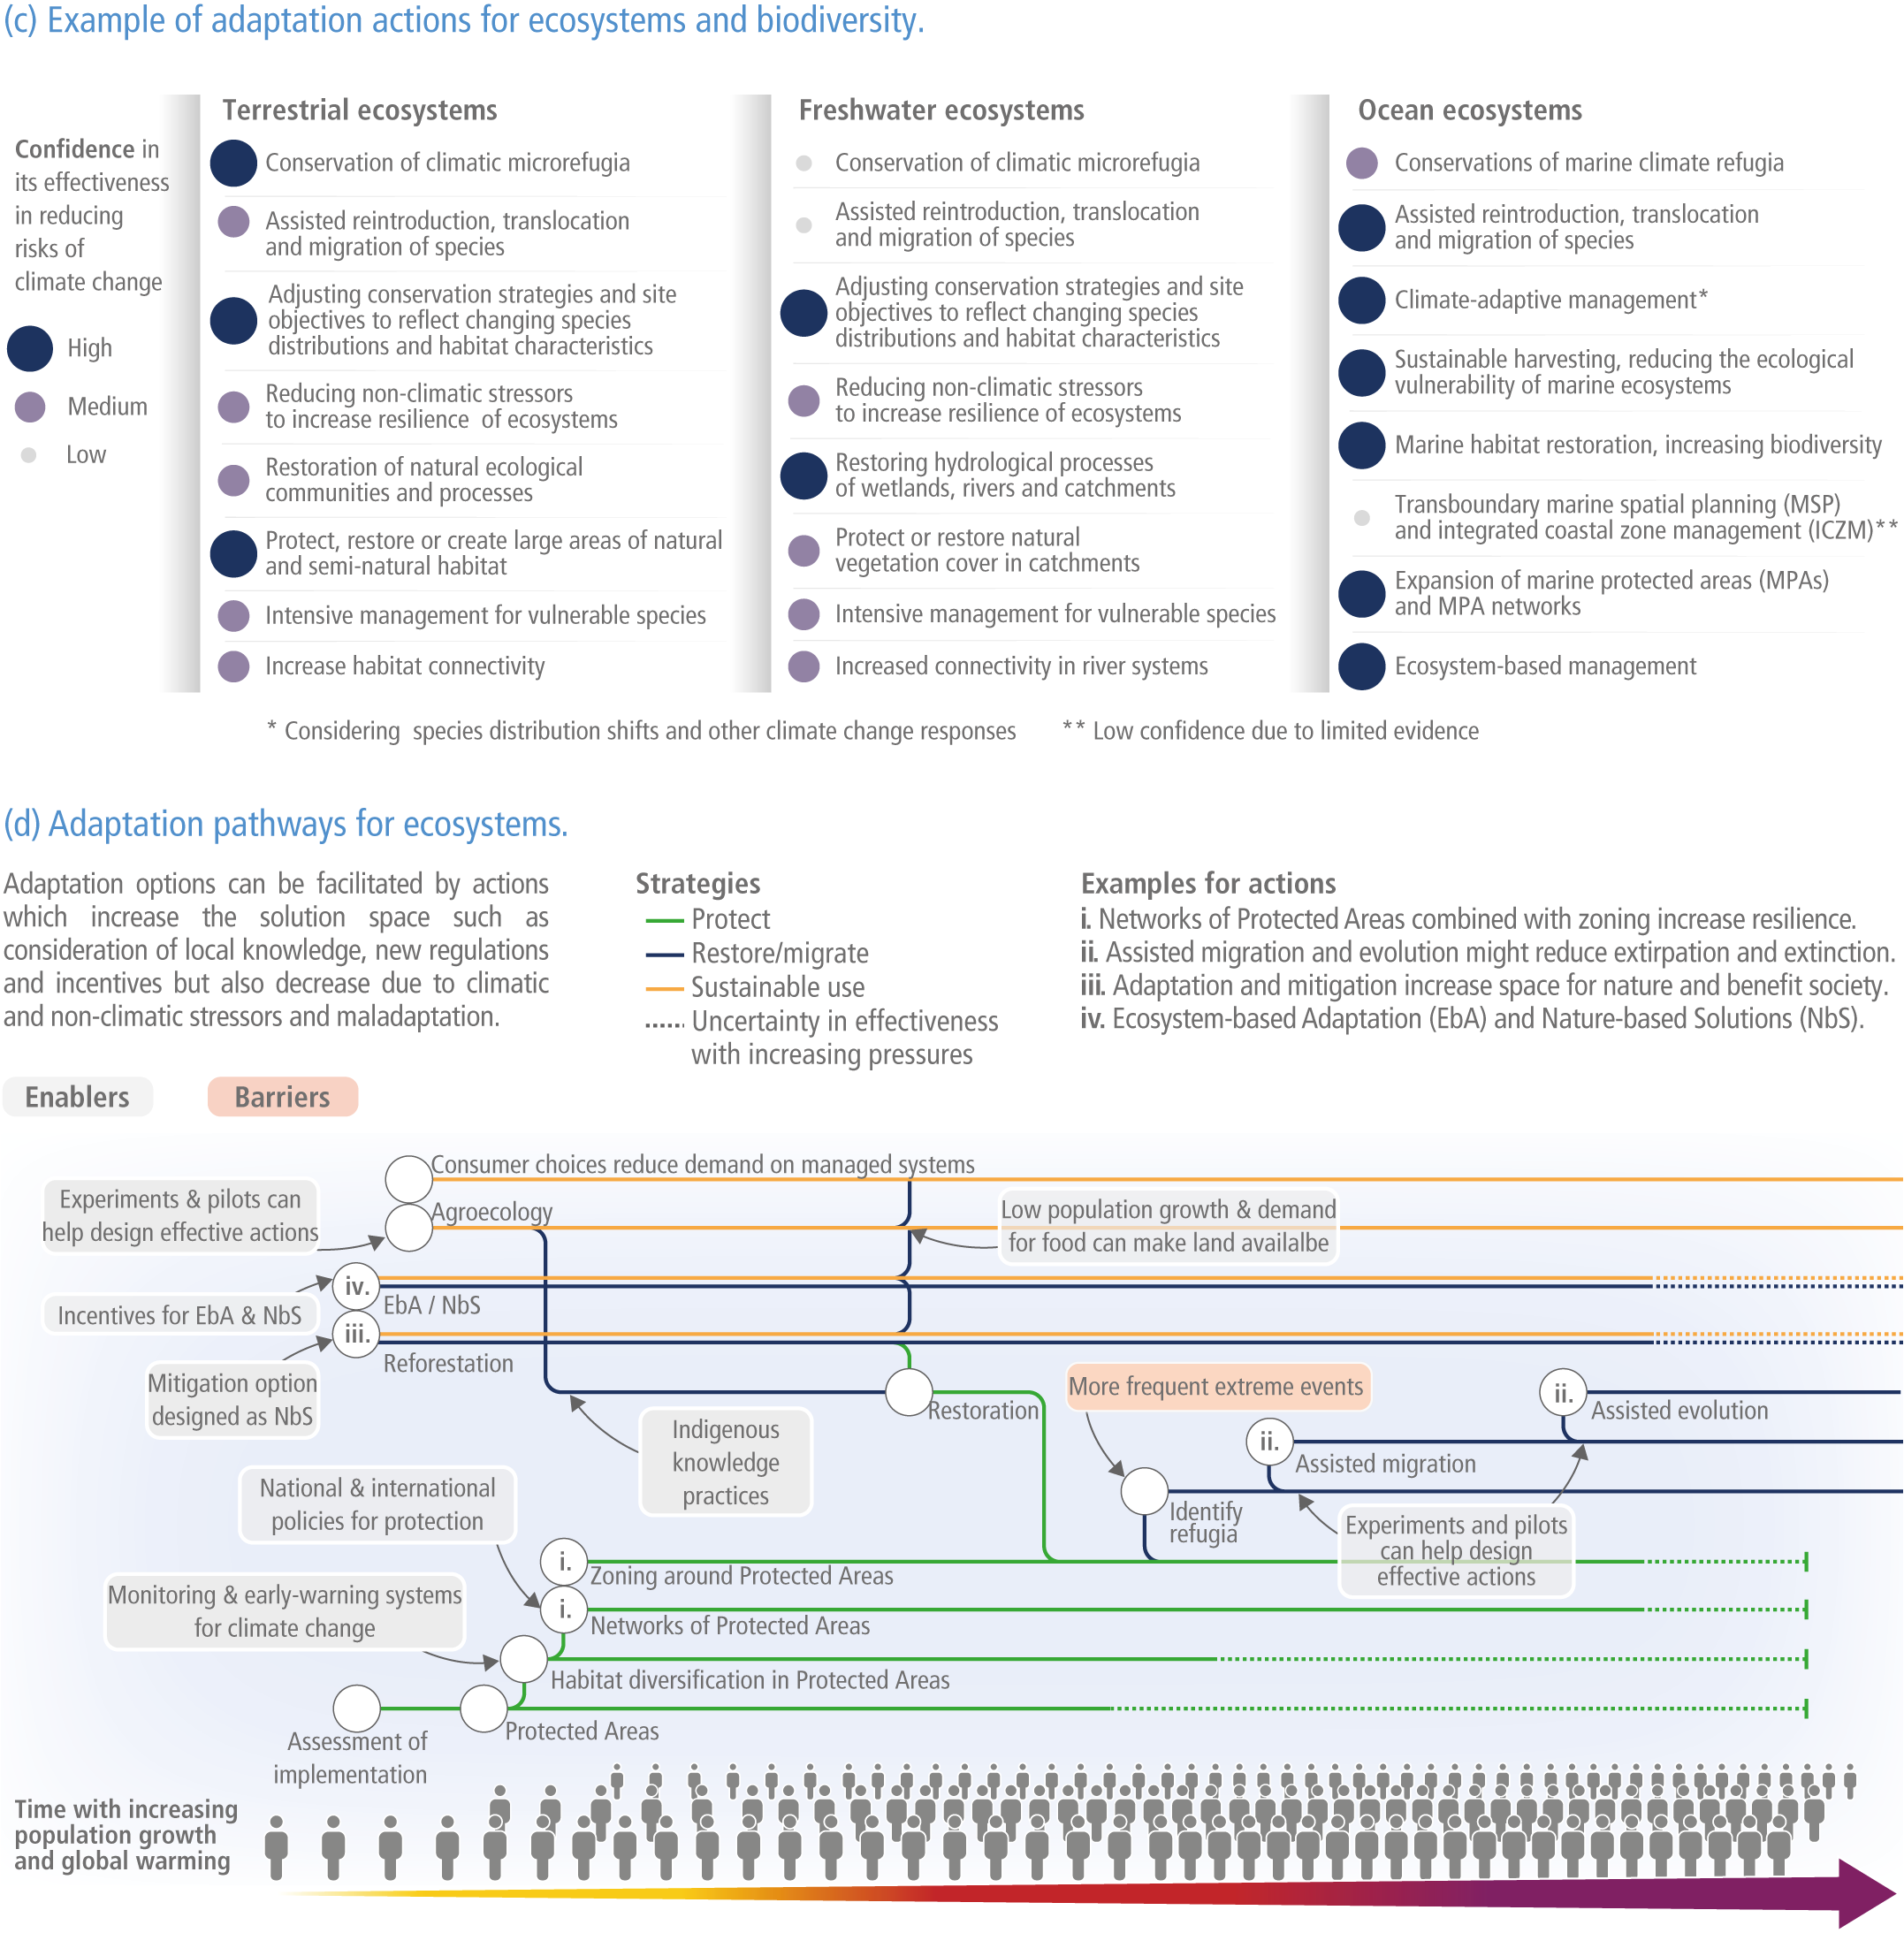
Figure caption
Figure TS.5 ECOSYSTEMS | (a) Left: Observed global and regional impacts on ecosystems and human systems attributed to climate change. Confidence levels reflect uncertainty in attribution of the observed impact to climate change. For more details and line of sight to chapters and cross-chapter papers see Figure TS.3a, SMTS.1 and Table SMTS.1. Right: Observed species richness across latitude for three historical periods. {3.4.3, Figure 3.18}. (b) Left: Global warming levels (GMST) modelled across the ranges of more than 30,000 marine and terrestrial species. Middle: Global warming levels (GSAT); change indicated by the proportion of species (modelled n=119,813 species globally) for which the climate is projected to become unsuitable across their current distributions. Right: Modelled 12,796 marine species globally. {2.5.1, Figure 2.6, 3.4.3, Figure 3.18, Figure 3.20a, CCP1.2.4, Figures AI.6, AI.15, AI.16}. (c) {2.6.2, Table 2.6, 3.6.2, Figure 3.24}. (d) Some actions facilitate sustainable use but also increase space for nature. {2.4 2, 2.6.2, 2.6.3, 2.6.5, 2.6.7, 2.6.8, 3.6.2, 3.6.5, Table 3.30, 5.6.3, Box 5.11, 9.3.1, 9.3.2, 9.6.3, 9.6.4, 9.12 .3, 10.4.2, 10.4.3, 11.3.1, 11 .3.2, 11 .7.3, 12.5. 1, 12. 5.2, 12.5.9, 12.6.1, 13.3.2, 13.4.2, 13.5 .2, 13.10.2, 14.5.1, 14.5.2, Box 14.2, Box 14.7, 15.5.4, 15.3.3, Table 15 .6, 16.5.2, 16.6.3, CCP1.3, CCP3. 2.2, CCP4.4.1, CCP5 .2.5, CCP5.4.1, CCP6.3.2, CCP7.5, CCP7 .5. 1, CCPBox7.1, Table CCP7 .3, CCB EXTREMES, CCB NATURAL}