Figure: SPM.2
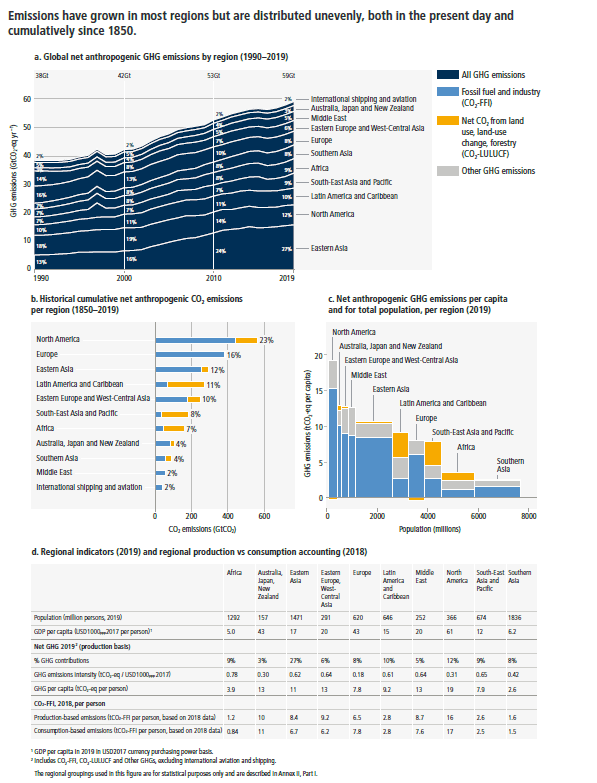
Figure: SPM.2: Regional GHG emissions, and the regional proportion of total cumulative production-based CO2 emissions from 1850–2019 Panel a shows global net anthropogenic GHG emissions by region (in GtCO2-eq yr-1 (GWP100 AR6)) for the time period 1990–2019 [FOOTNOTE 5]. Percentage values refer to the contribution of each region to total GHG emissions in each respective time period. The single year peak of emissions in 1997 was due to higher CO2-LULUCF emissions from a forest and peat fire event in South East Asia. Regions are as grouped in Annex II.
Panel b shows the share of historical cumulative net anthropogenic CO2 emissions per region from 1850 to 2019 in GtCO2. This includes CO2 from fossil fuel combustion and industrial processes (CO2-FFI) and net CO2 Land use, land use change, forestry (CO2-LULUCF). Other GHG emissions are not included [FOOTNOTE 5]. CO2-LULUCF emissions are subject to high uncertainties, reflected by a global uncertainty estimate of ± 70% (90% confidence interval).
Panel c shows the distribution of regional GHG emissions in tonnes CO2-eq per capita by region in 2019. GHG emissions are categorised into: CO2-FFI, net CO2-LULUCF and other GHG emissions (methane, nitrous oxide, fluorinated gases, expressed in CO2-eq using GWP100-AR6). The height of each rectangle shows per-capita emissions, the width shows the population of the region, so that the area of the rectangles refers to the total emissions for each region. Emissions from international aviation and shipping are not included. In the case of two regions, the area for CO2-LULUCF is below the axis, indicating net CO2 removals rather than emissions. CO2-LULUCF emissions are subject to high uncertainties, reflected by a global uncertainty estimate of ± 70% (90% confidence interval).
Panel d shows population, GDP per person, emission indicators by region in 2019 for percentage GHG contributions, total GHG per person, and total GHG emissions intensity, together with production-based and consumption-based CO2-FFI data, which is assessed in this report up to 2018. Consumption-based emissions are emissions released to the atmosphere in order to generate the goods and services consumed by a certain entity (e.g., region). Emissions from international aviation and shipping are not included.
{1.3, Figure 1.2, 2.2, Figure 2.9, Figure 2.10, Figure 2.11, Annex II}
