Annex IV Figure 5
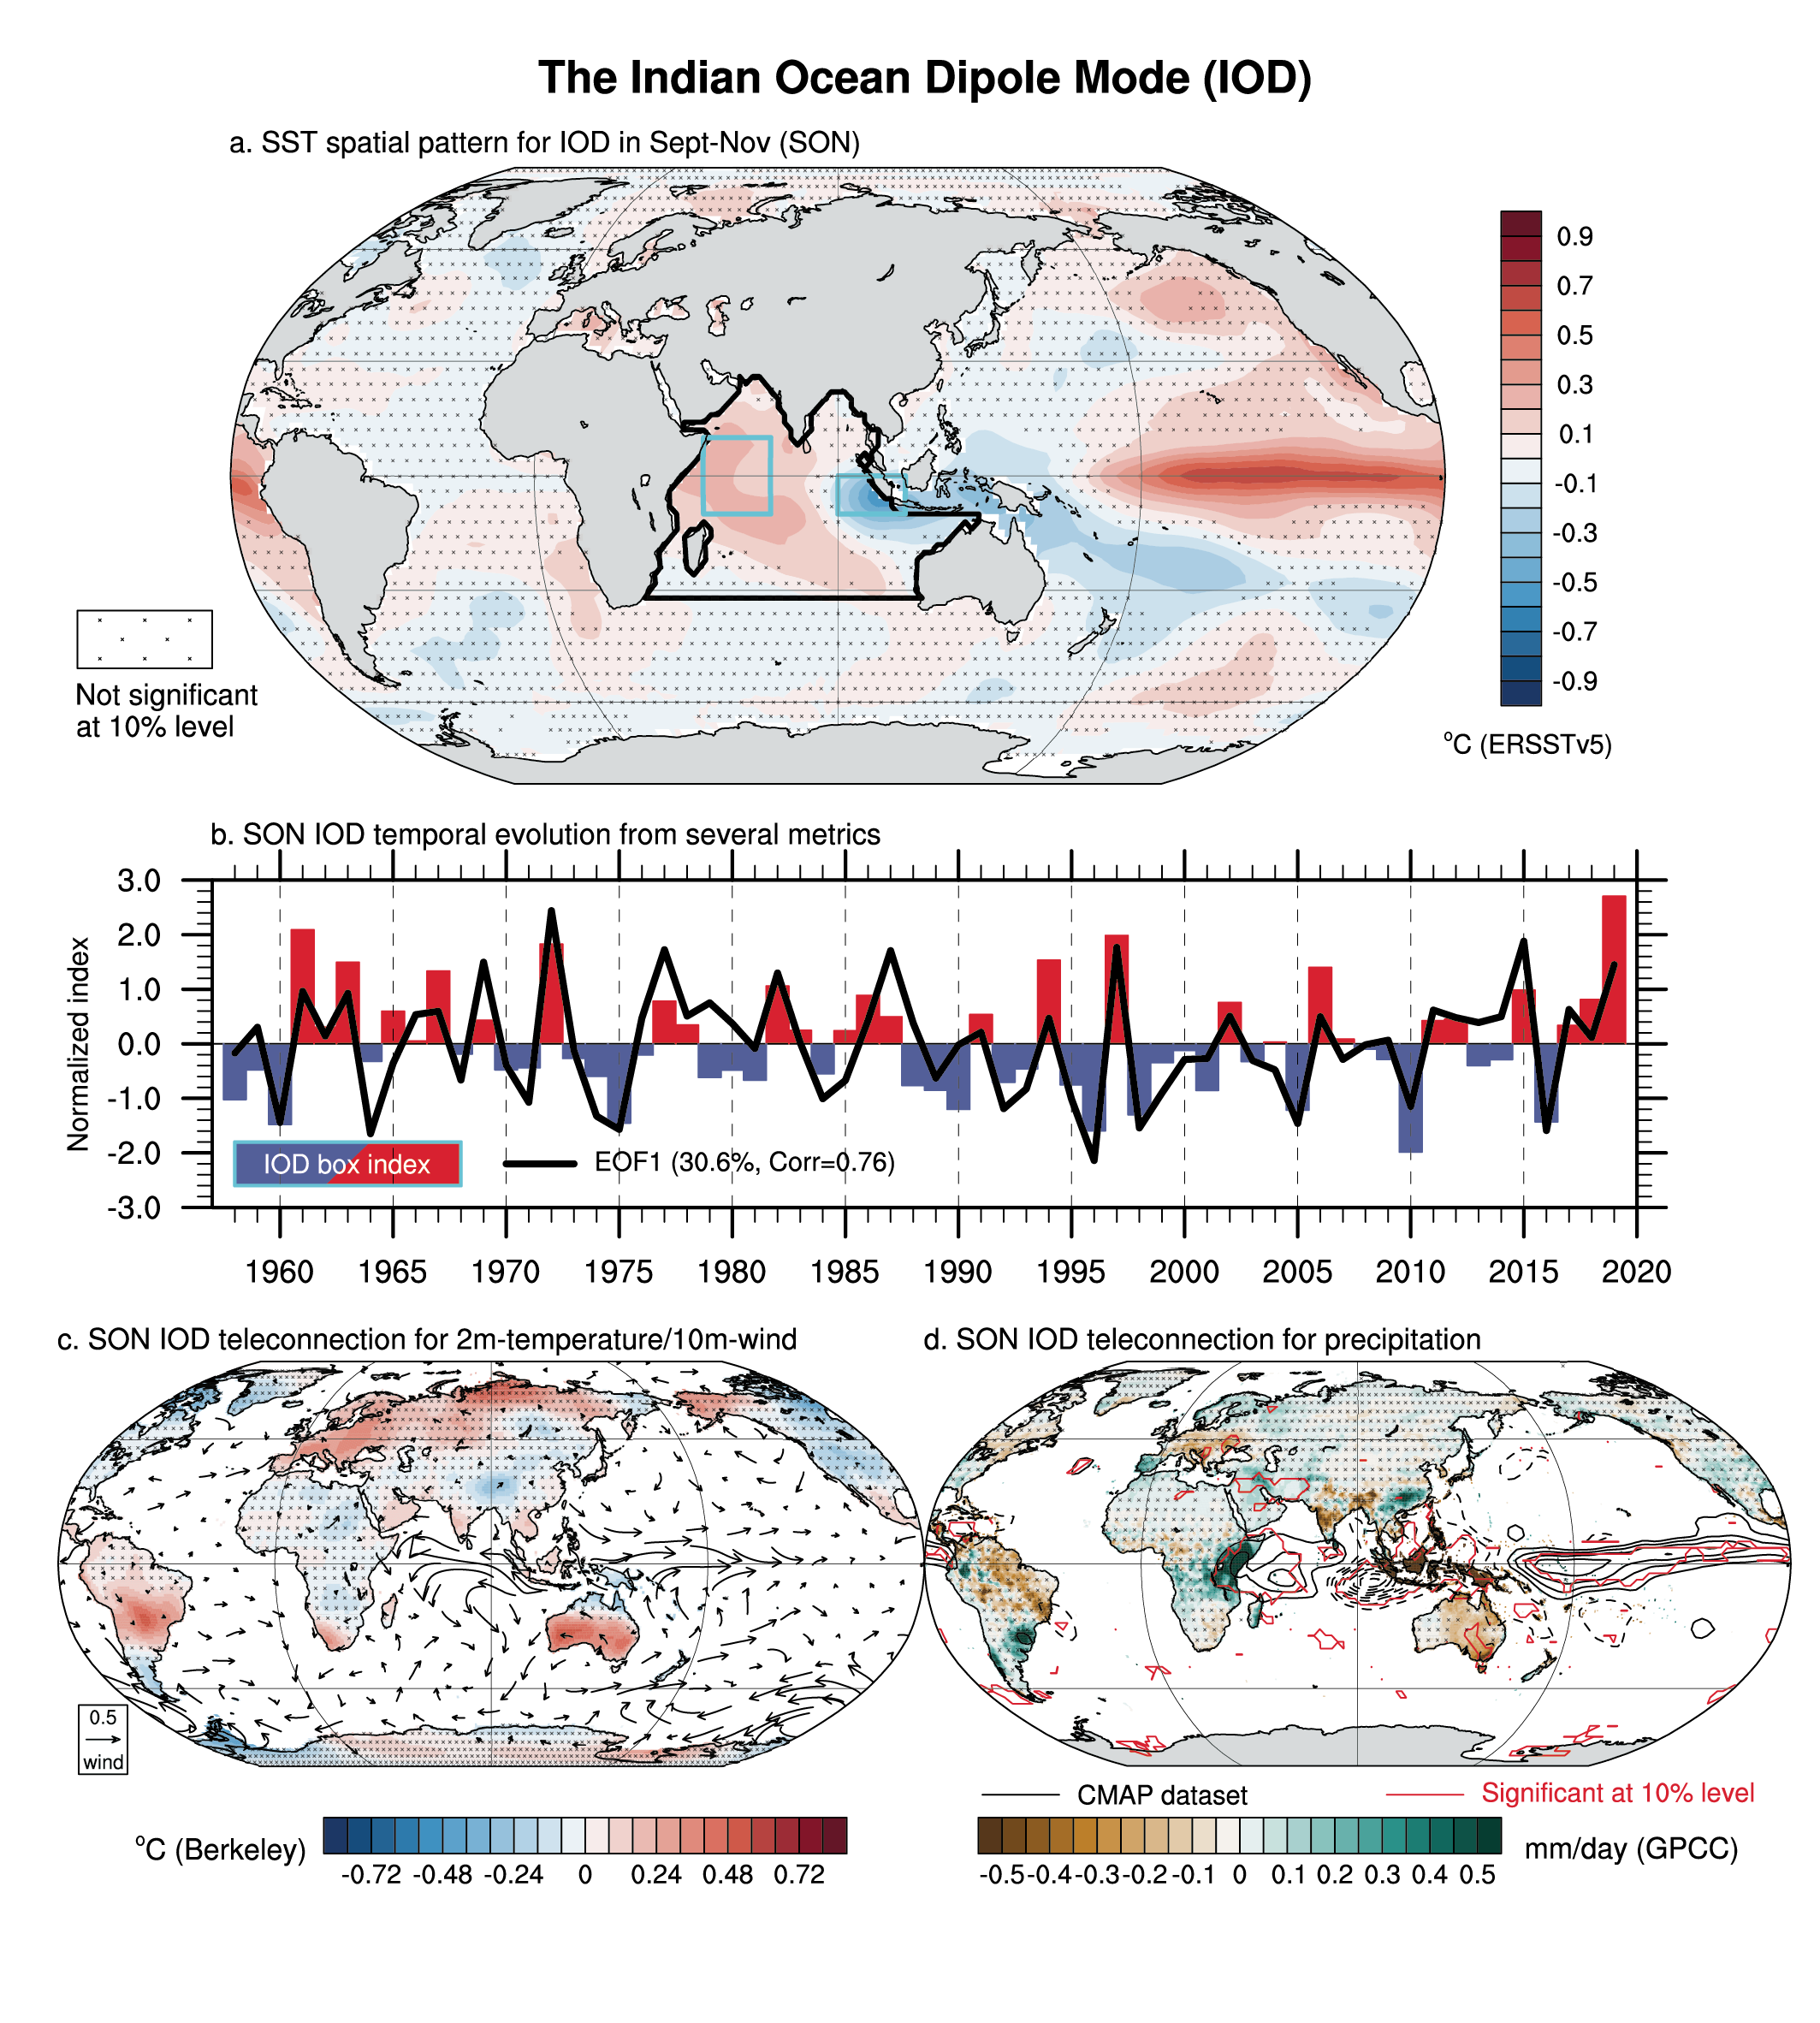
Figure caption
Figure AIV.5 | The boreal autumn Indian Ocean Dipole (IOD) mode defined by September–October–November (SON) standardized SST difference between the western (10°S–10°N, 50°E–70°E) and eastern (10°S–0°, 90°E–110°E) equatorial Indian Ocean denoted by cyan boxes in (a) or extracted as the leading empirical orthogonal function (EOF) mode over the Indian Ocean (the region denoted by black lines in (a)) over 1958–2019 using ERSSTv5. (a) SST anomalies regressed onto the IOD index time series shown in (b) in red and blue bars, while the black curve represents the leading principal component time series. Explained variance and correlation between indices are given in the legend in (b). (c) Same as (a) but for land surface air temperature (shading; based on Berkeley Earth) and 10 m level wind (arrows; m s–1 based on JRA-55) anomalies for 1958–2018. (d) Same as (a) but for precipitation anomalies (shading based on GPCC for 1958–2016 and contours based on CMAP for 1979–2019 for every 0.3 mm day–1). On maps, no overlay indicates regions where the regressions are significant based on t-test accounting for false detection rates at 10% and crosses indicates no significance. Significance for CMAP precipitation is materialized by red contours in (d). All fields have been linearly detrended prior to computation.