Annex IV Figure 8
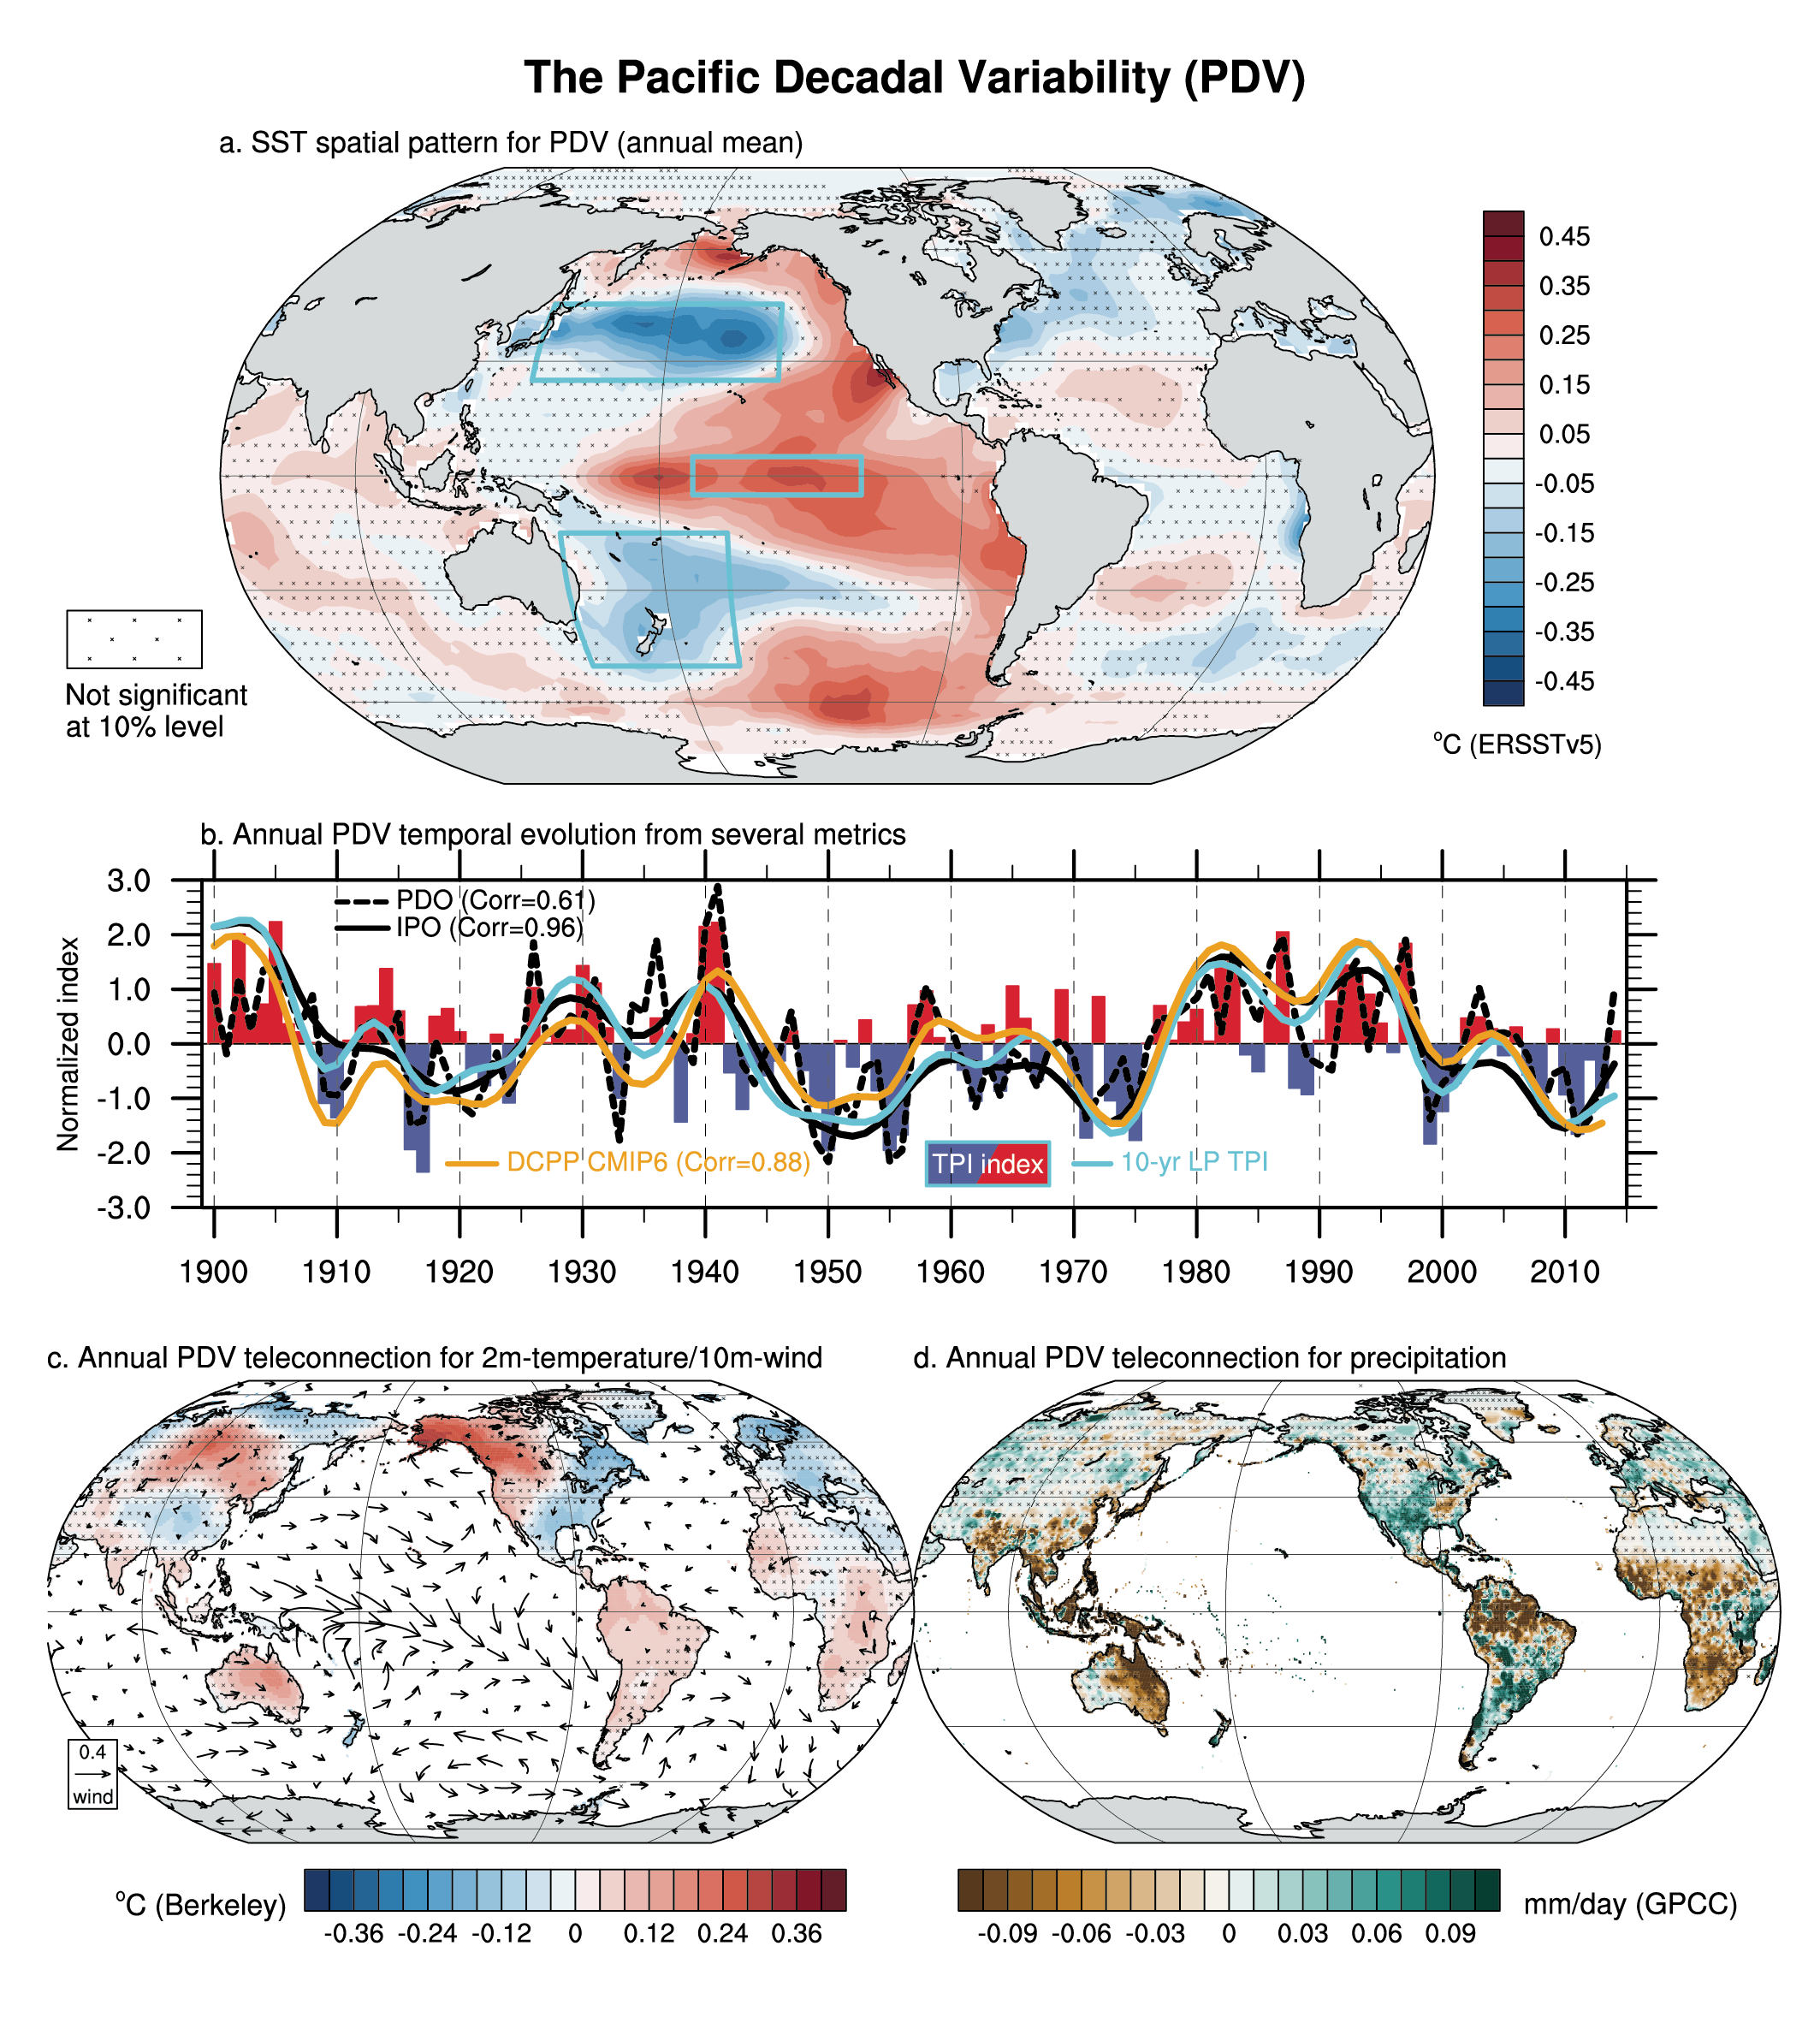
Figure caption
Figure AIV.8 | The Pacific Decadal Variability (PDV) based on the tripole index (TPI) for 1900–2014 after 10-year low-pass filtering. (a) Sea surface temperature (SST) anomalies regressed onto TPI based on ERSSTv5. The cyan boxes indicate regions for the TPI definition. (b) Temporal evolution of the raw TPI (bars), the 10-year low-pass filtered TPI (cyan curve), the empirical orthogonal function (EOF)-based Pacific Decadal Oscillation (PDO) index (dashed black) and two estimations of the Inter-decadal Pacific Oscillation (IPO) EOF-based indices. In solid black, linear detrending is applied to annual data prior to the computation of the EOF of the low-pass filtered SST to remove the forced component in the SST field. In orange, the forced signal is estimated from CMIP5 historical simulations following Ting et al. (2009). The latter metric is used in CMIP6 DCPP-C sensitivity experiments (Boer et al. 2016). The correlation between the low-pass filtered TPI and all PDV indices is given in the legend. (c) Same as (a) but for land surface air temperature (shading; based on Berkeley Earth for 1900–2014) and 10 m level wind (arrows; m s–1 based on JRA-55 for 1958–2014) anomalies. (d) Same as (a) but for precipitation anomalies (shading based on GPCC for 1900–2014). All are based on annual mean. On maps, no overlay indicates regions where the regressions are significant based on t-test accounting for false detection rates at 10% and crosses indicates no significance.