Annex IV Figure 9
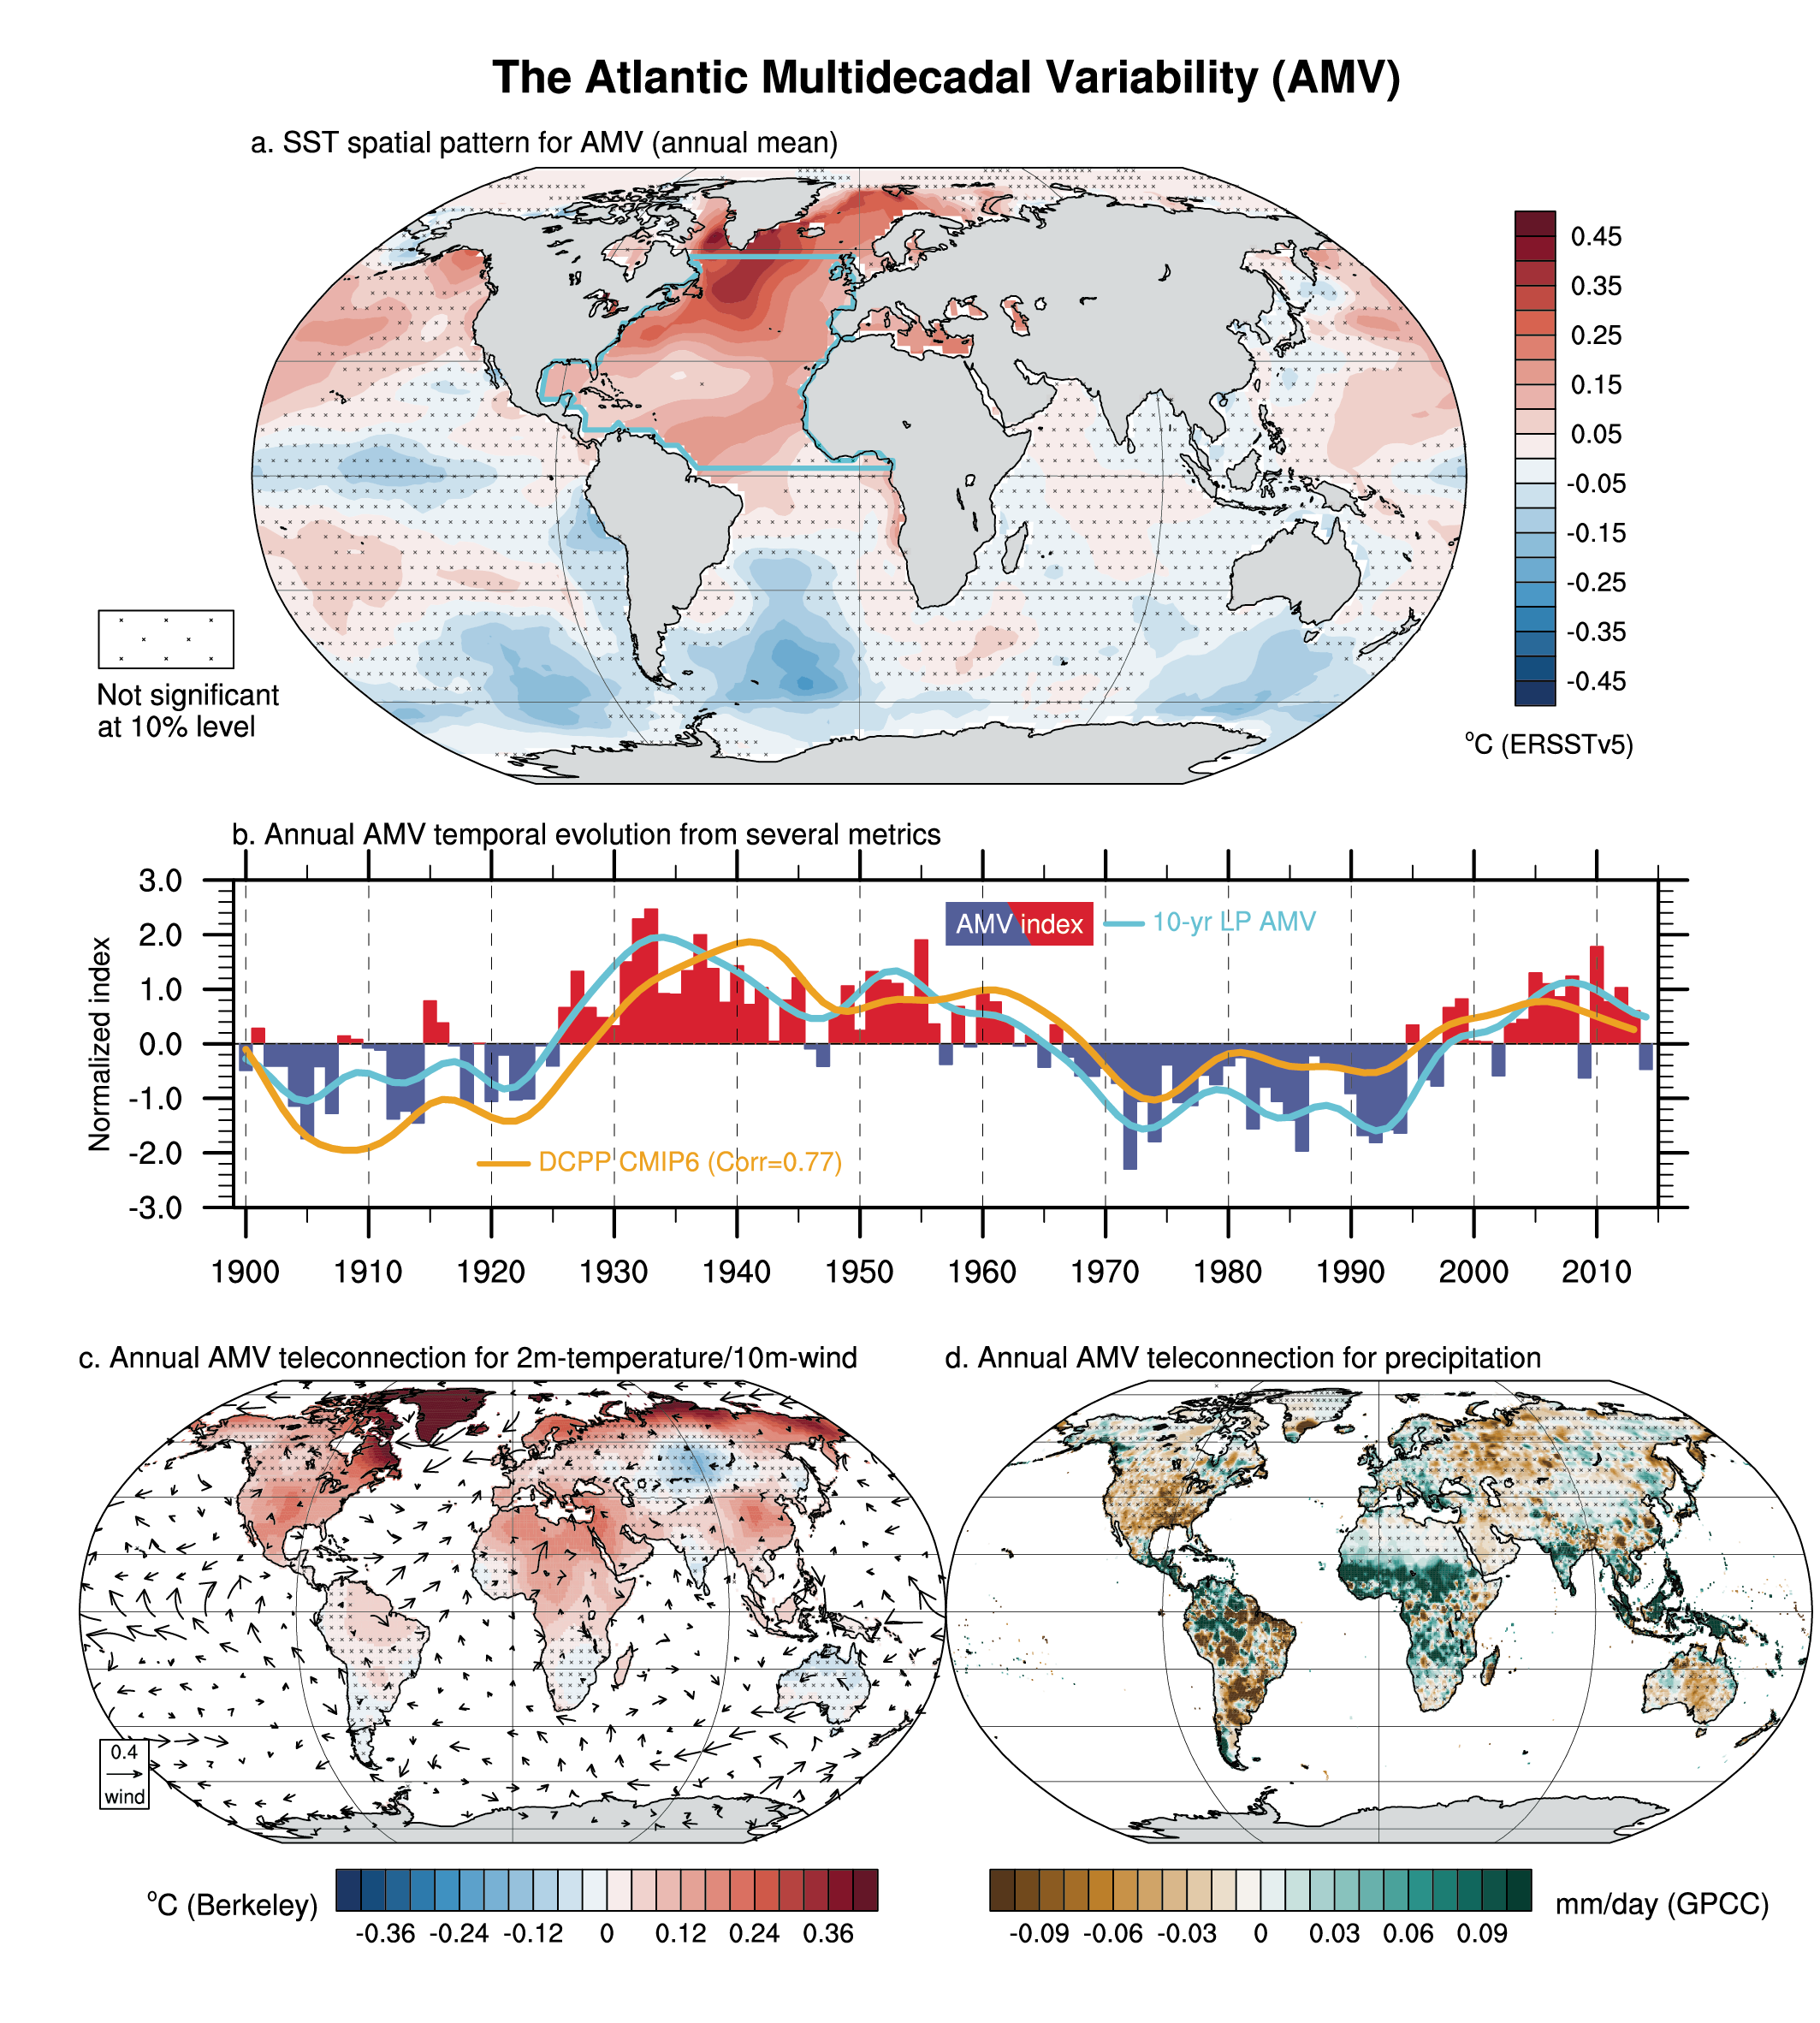
Figure caption
Figure AIV.9 | The Atlantic Multi-decadal Variability (AMV) based on the AMV index defined from Trenberth and Shea (2006) for 1900–2014 after 10-year low-pass filtering. The index corresponds to the annual sea surface temperature (SST) averaged over the North Atlantic domain (cyan box) minus the near-global average (60°N–60°S). (a) SST anomalies regressed onto the AMV index based on ERSSTv5. (b) The cyan curve indicates the 10-year low-pass filtered AMV index shown in bars. The orange curve stands for the AMV index used for the CMIP6 DCPP-C sensitivity experiments (Boer et al. 2016). (c) Same as (a) but for land surface air temperature (shading; based on Berkeley Earth for 1900–2014) and 10 m level wind (arrows; m s–1 based on JRA-55 for 1958–2014) anomalies. (d) Same as (a) but for precipitation anomalies (shading based on GPCC for 1900–2014). All is based on annual mean. On maps, no overlay indicates regions where the regressions are significant based on t-test accounting for false detection rates at 10% and crosses indicates no significance.