Box Atlas.1, Figure 1
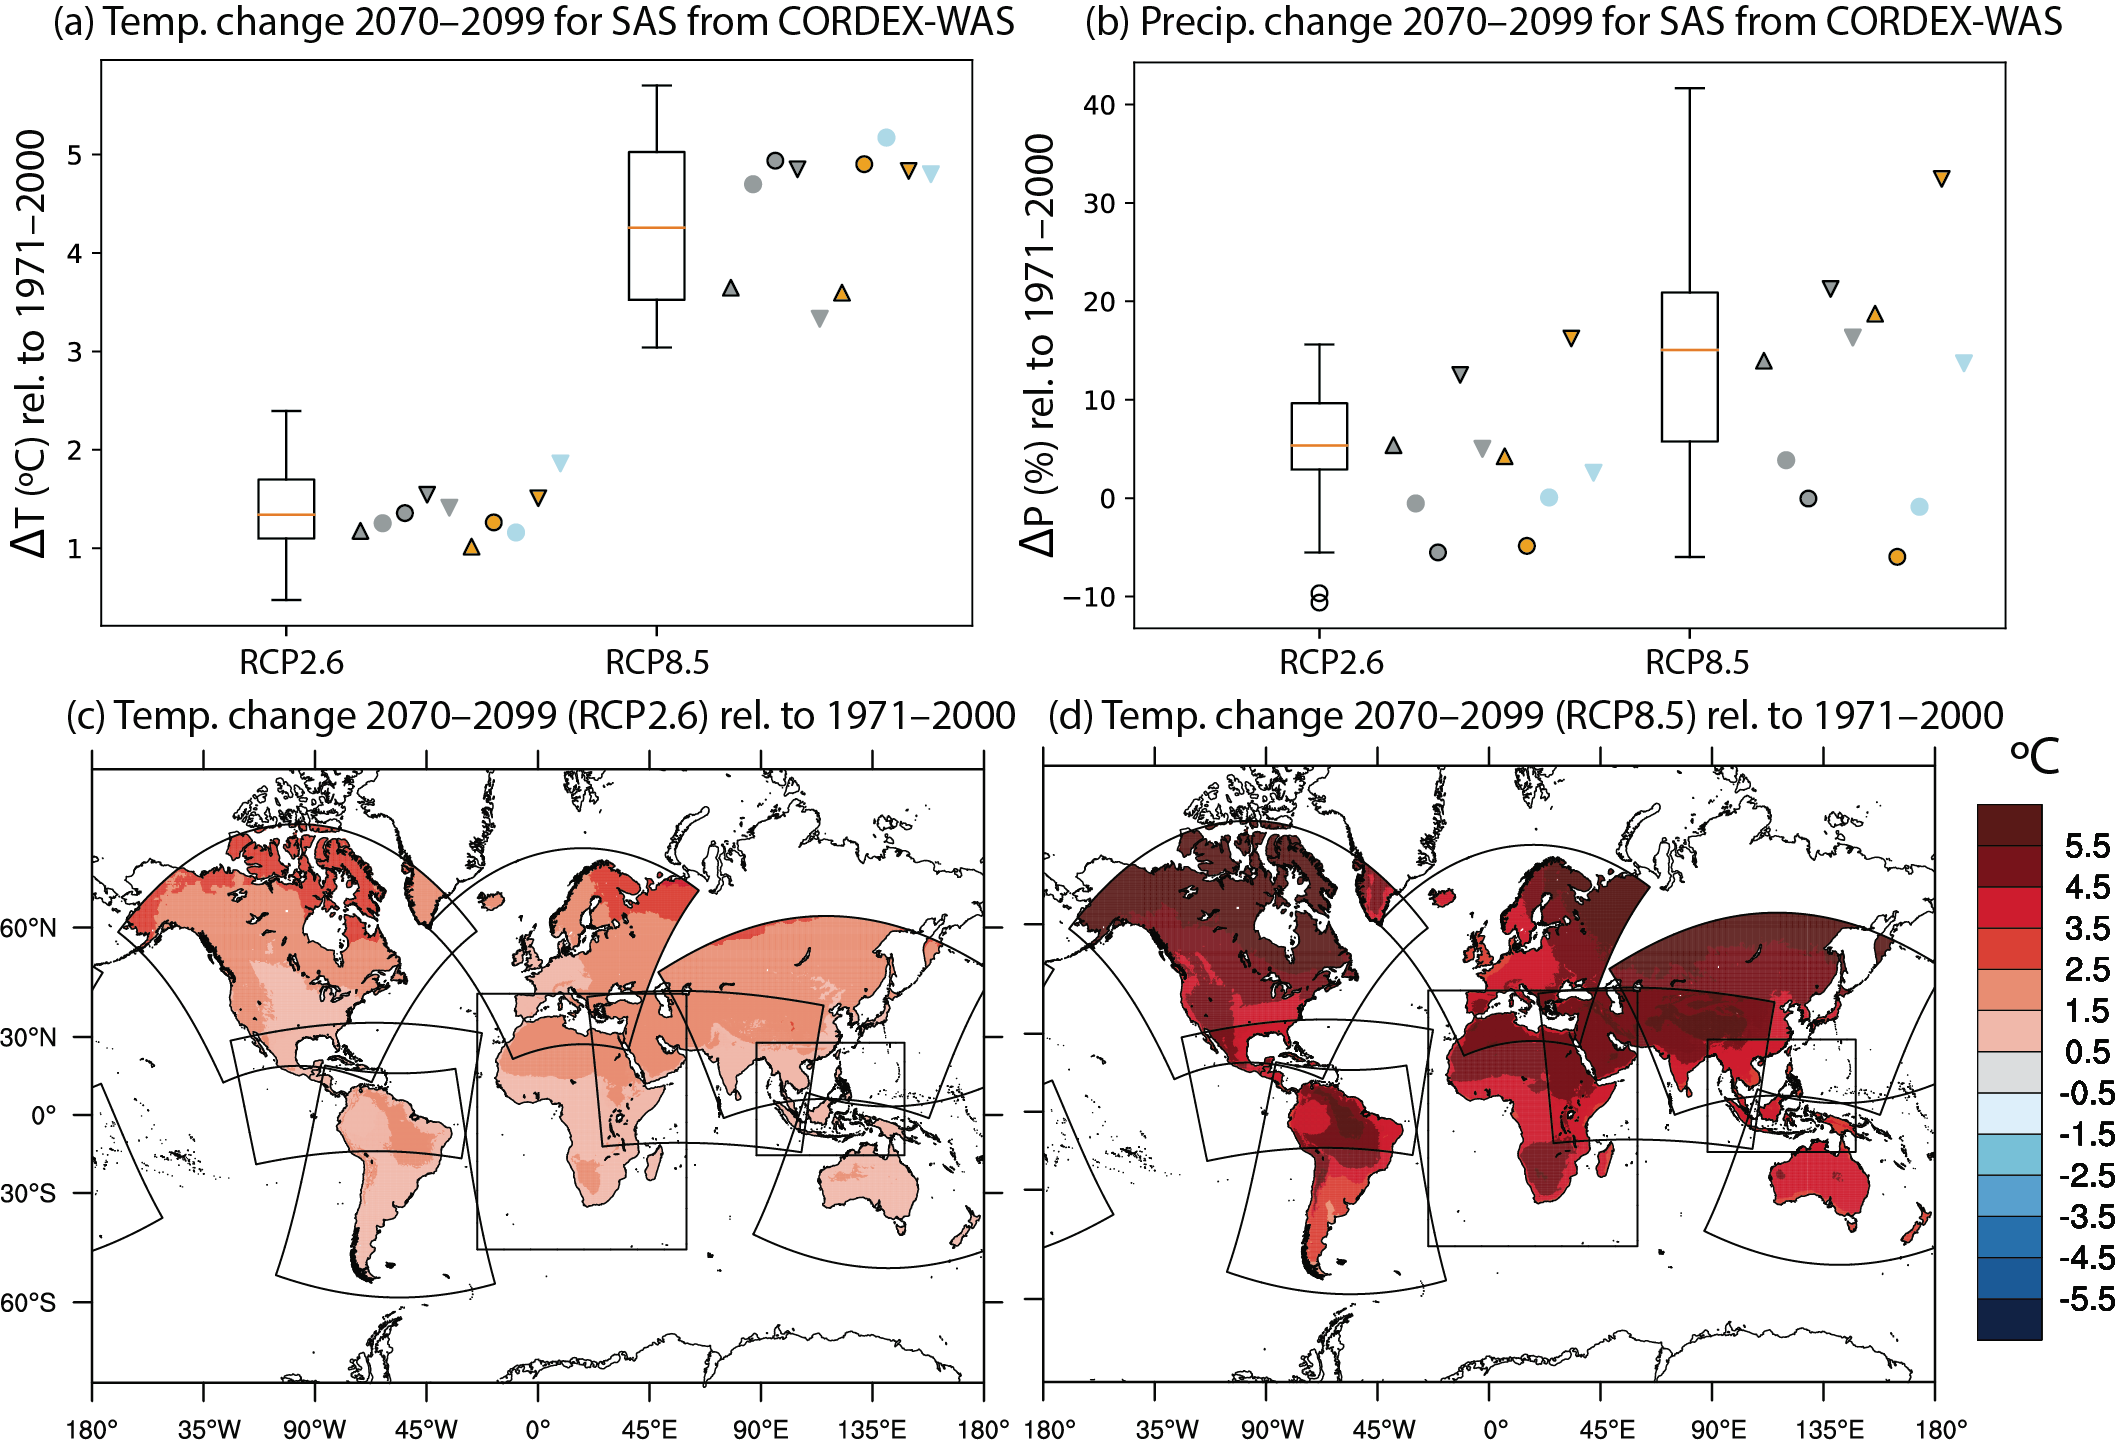
Figure caption
Box Atlas.1, Figure1 | Temperature and precipitation climate change signals at the end of the century (2070–2099). The top panels show climate change signals for (a) temperature and (b) precipitation for the entire CMIP5 ensemble (box-whisker plots) and the CORDEX-CORE driving GCMs (grey symbols) of the respective CORDEX-CORE results (non-grey symbols) in the South Asia (SAS) reference region. The shape of the grey symbols represents the climate sensitivity of the driving GCMs: triangles pointing upwards (low equilibrium), circles (medium equilibrium), triangles pointing downwards (high equilibrium). The corresponding RCM results are drawn using the same symbols, but in orange for REMO and in blue for RegCM. The bottom panels show the warming signal by 2070–2099 over the CORDEX regions for RCP2.6 (c) and RCP8.5 (d) (Figure from Teichmann et al., 2021).