Back chapter figures
Cross-Chapter Box Atlas.1, Figure 1
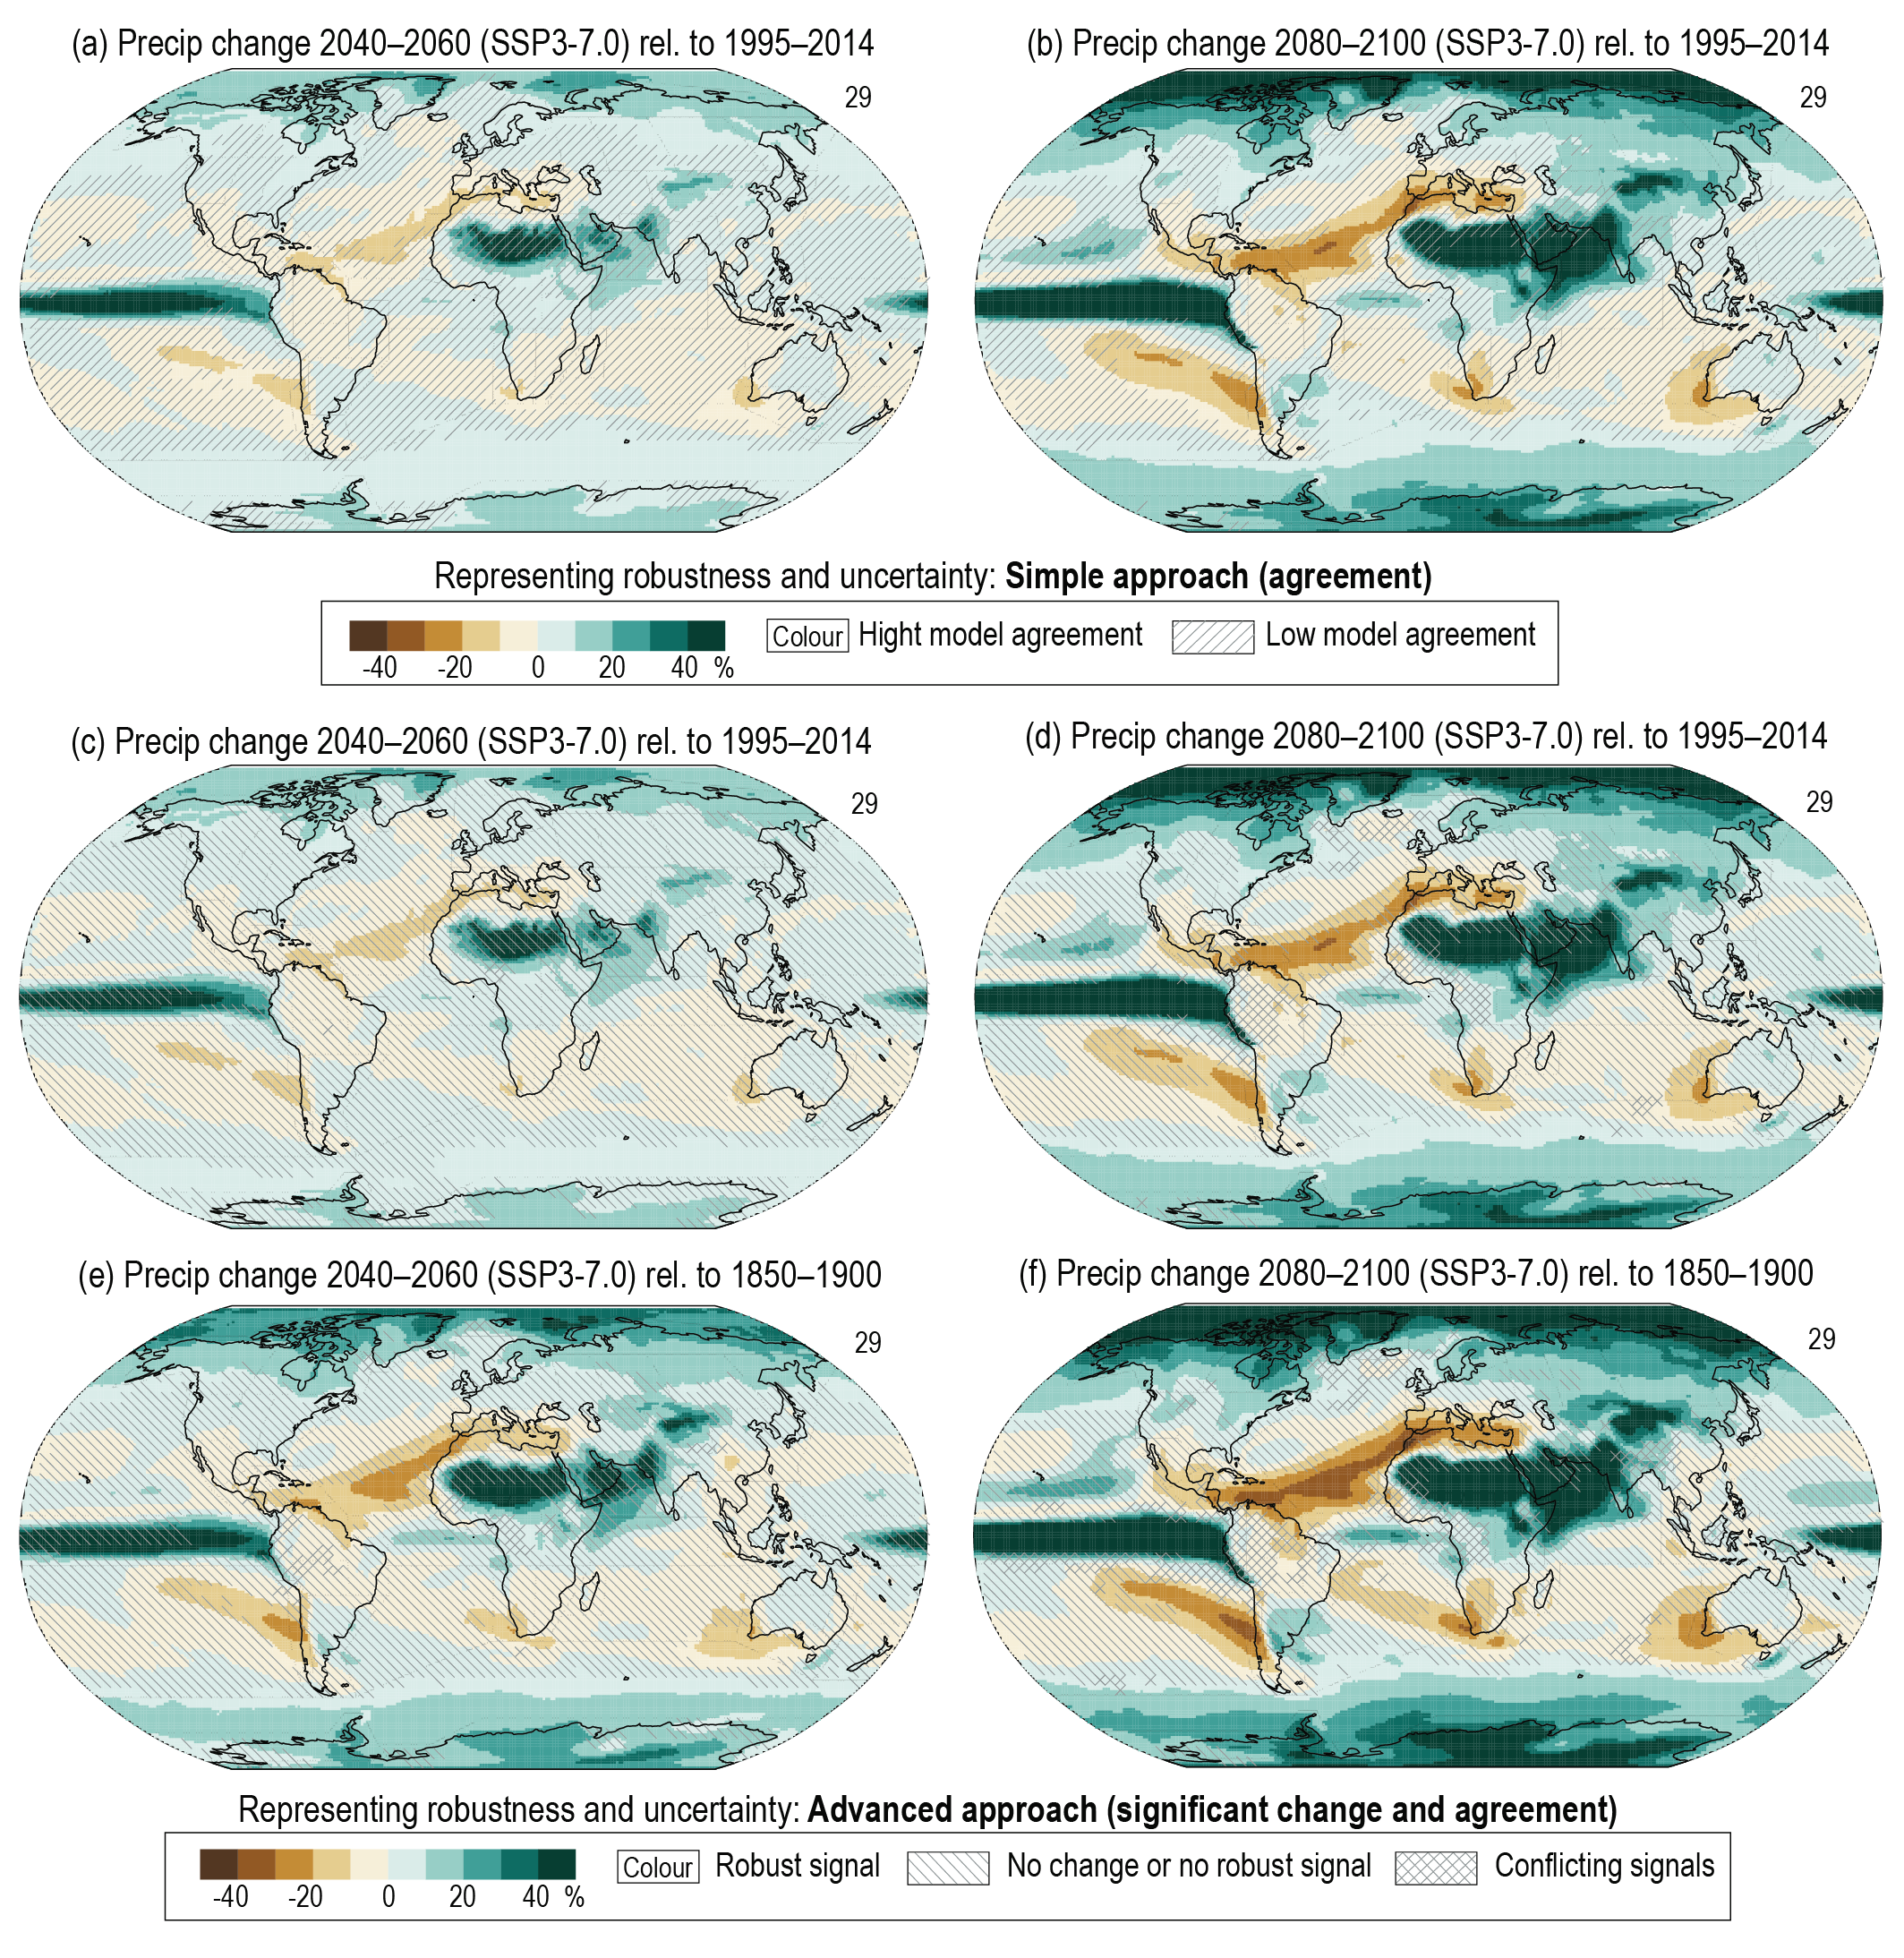
Figure caption
Cross-Chapter Box Atlas.1, Figure1 | Illustration of the simple, (a) and (b), and advanced, (c–f), approaches (B and C in Cross-Chapter Box Atlas.1, Table 1) for uncertainty representation in maps of future projections. Annual multi-model mean projected precipitation change (%) from CMIP6 for the period 2040–2060 (left) and 2080–2100 (right) relative to the baseline periods 1995–2014 (a–d) and 1850–1900 (e and f) under a high-emissions (SSP3-7.0) future. Diagonal and crossed lines follow the indications in Cross-Chapter Box Atlas.1, Table 1. Further details on data sources and processing are available in the chapter data table (Table Atlas.SM.15).