Back chapter figures
Figure Atlas.11
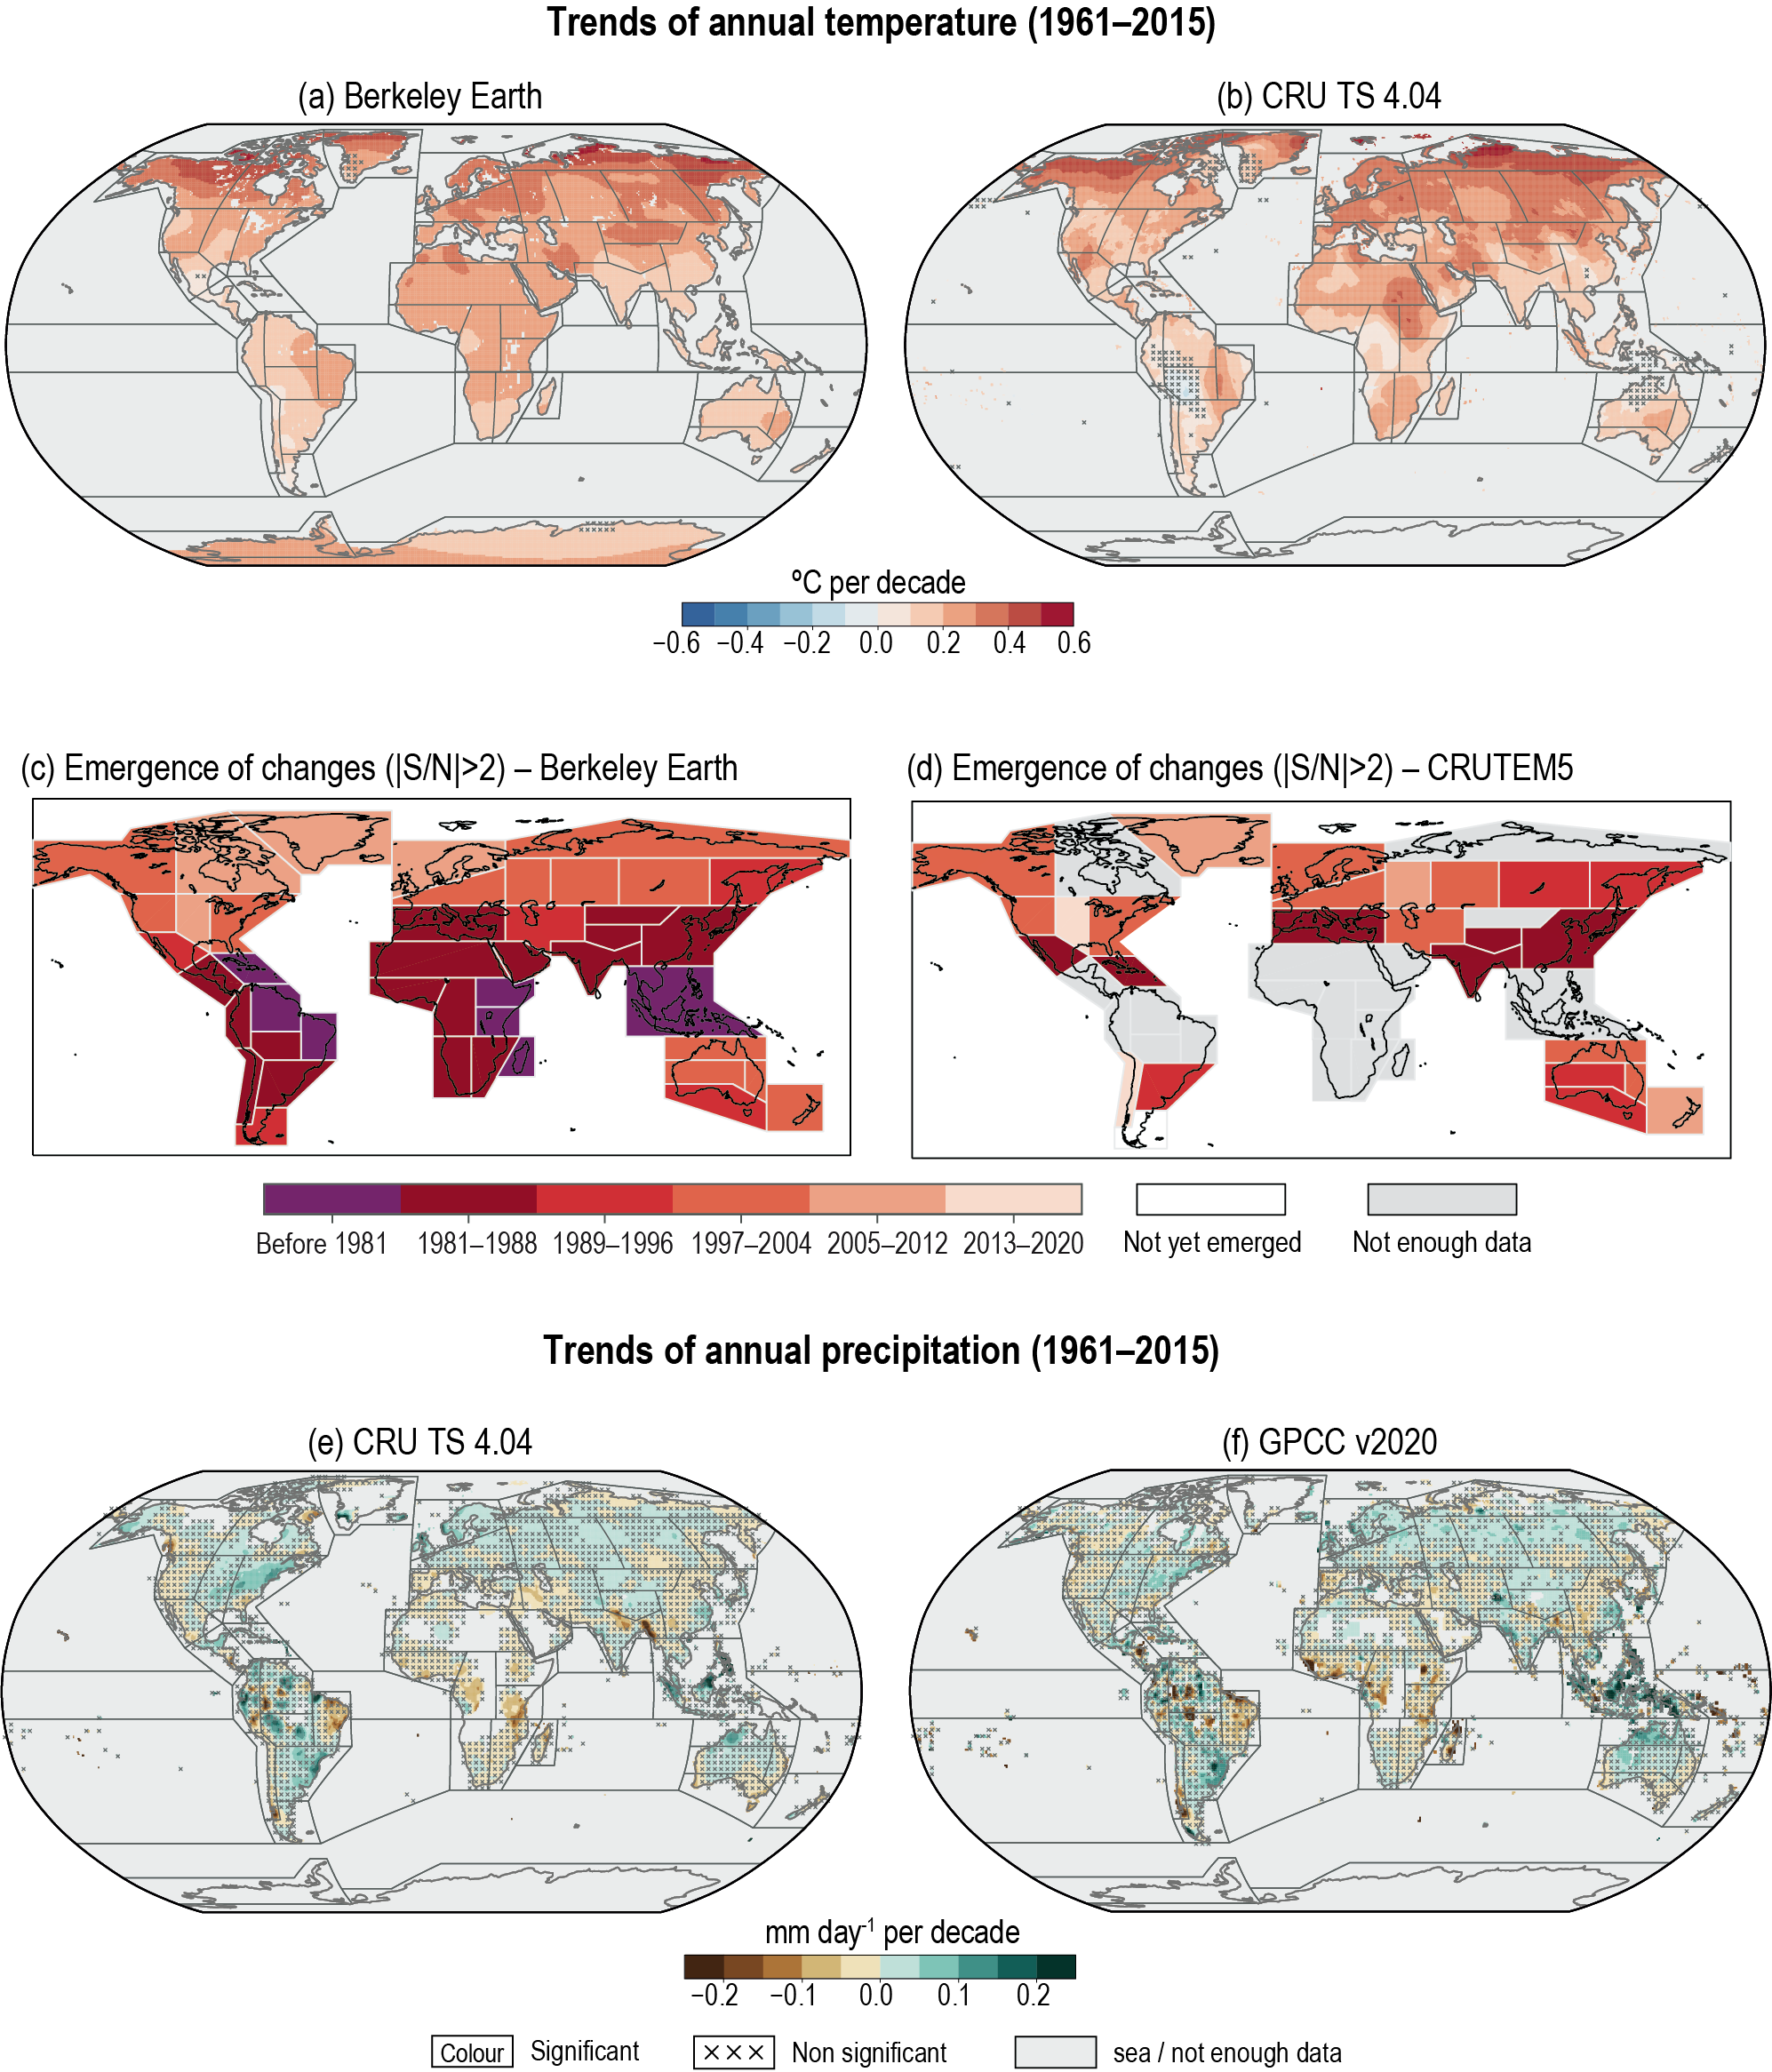
Figure caption
Figure Atlas.11 | Observed linear trends of signals in annual meansurface air temperature (a, b) and precipitation (e, f) in the Berkeley Earth, CRU TS and GPCC datasets (see Atlas.1 for dataset details). Trends are calculated for the common 1961–2015 period and are expressed as °C per decade for temperature and relative change (with respect to the climatological mean) per decade for precipitation. Crosses indicate regions where trends are not significant (at a 0.1 significance level) and the black lines mark out the reference regions defined in Atlas.1. Panels (c) and (d) display the period in which the signals of temperature change in data aggregated over the reference regions emerged from the noise of annual variability in the respective aggregated data. Emergence time is calculated for (c) Berkeley Earth (as used in (a)) and CRUTEM5. Regions in the CRUTEM5 map are shaded grey when data are available over less than 50% of the land area of the region. Further details on data sources and processing are available in the chapter data table (Table Atlas.SM.15).