Back chapter figures
Figure Atlas.12
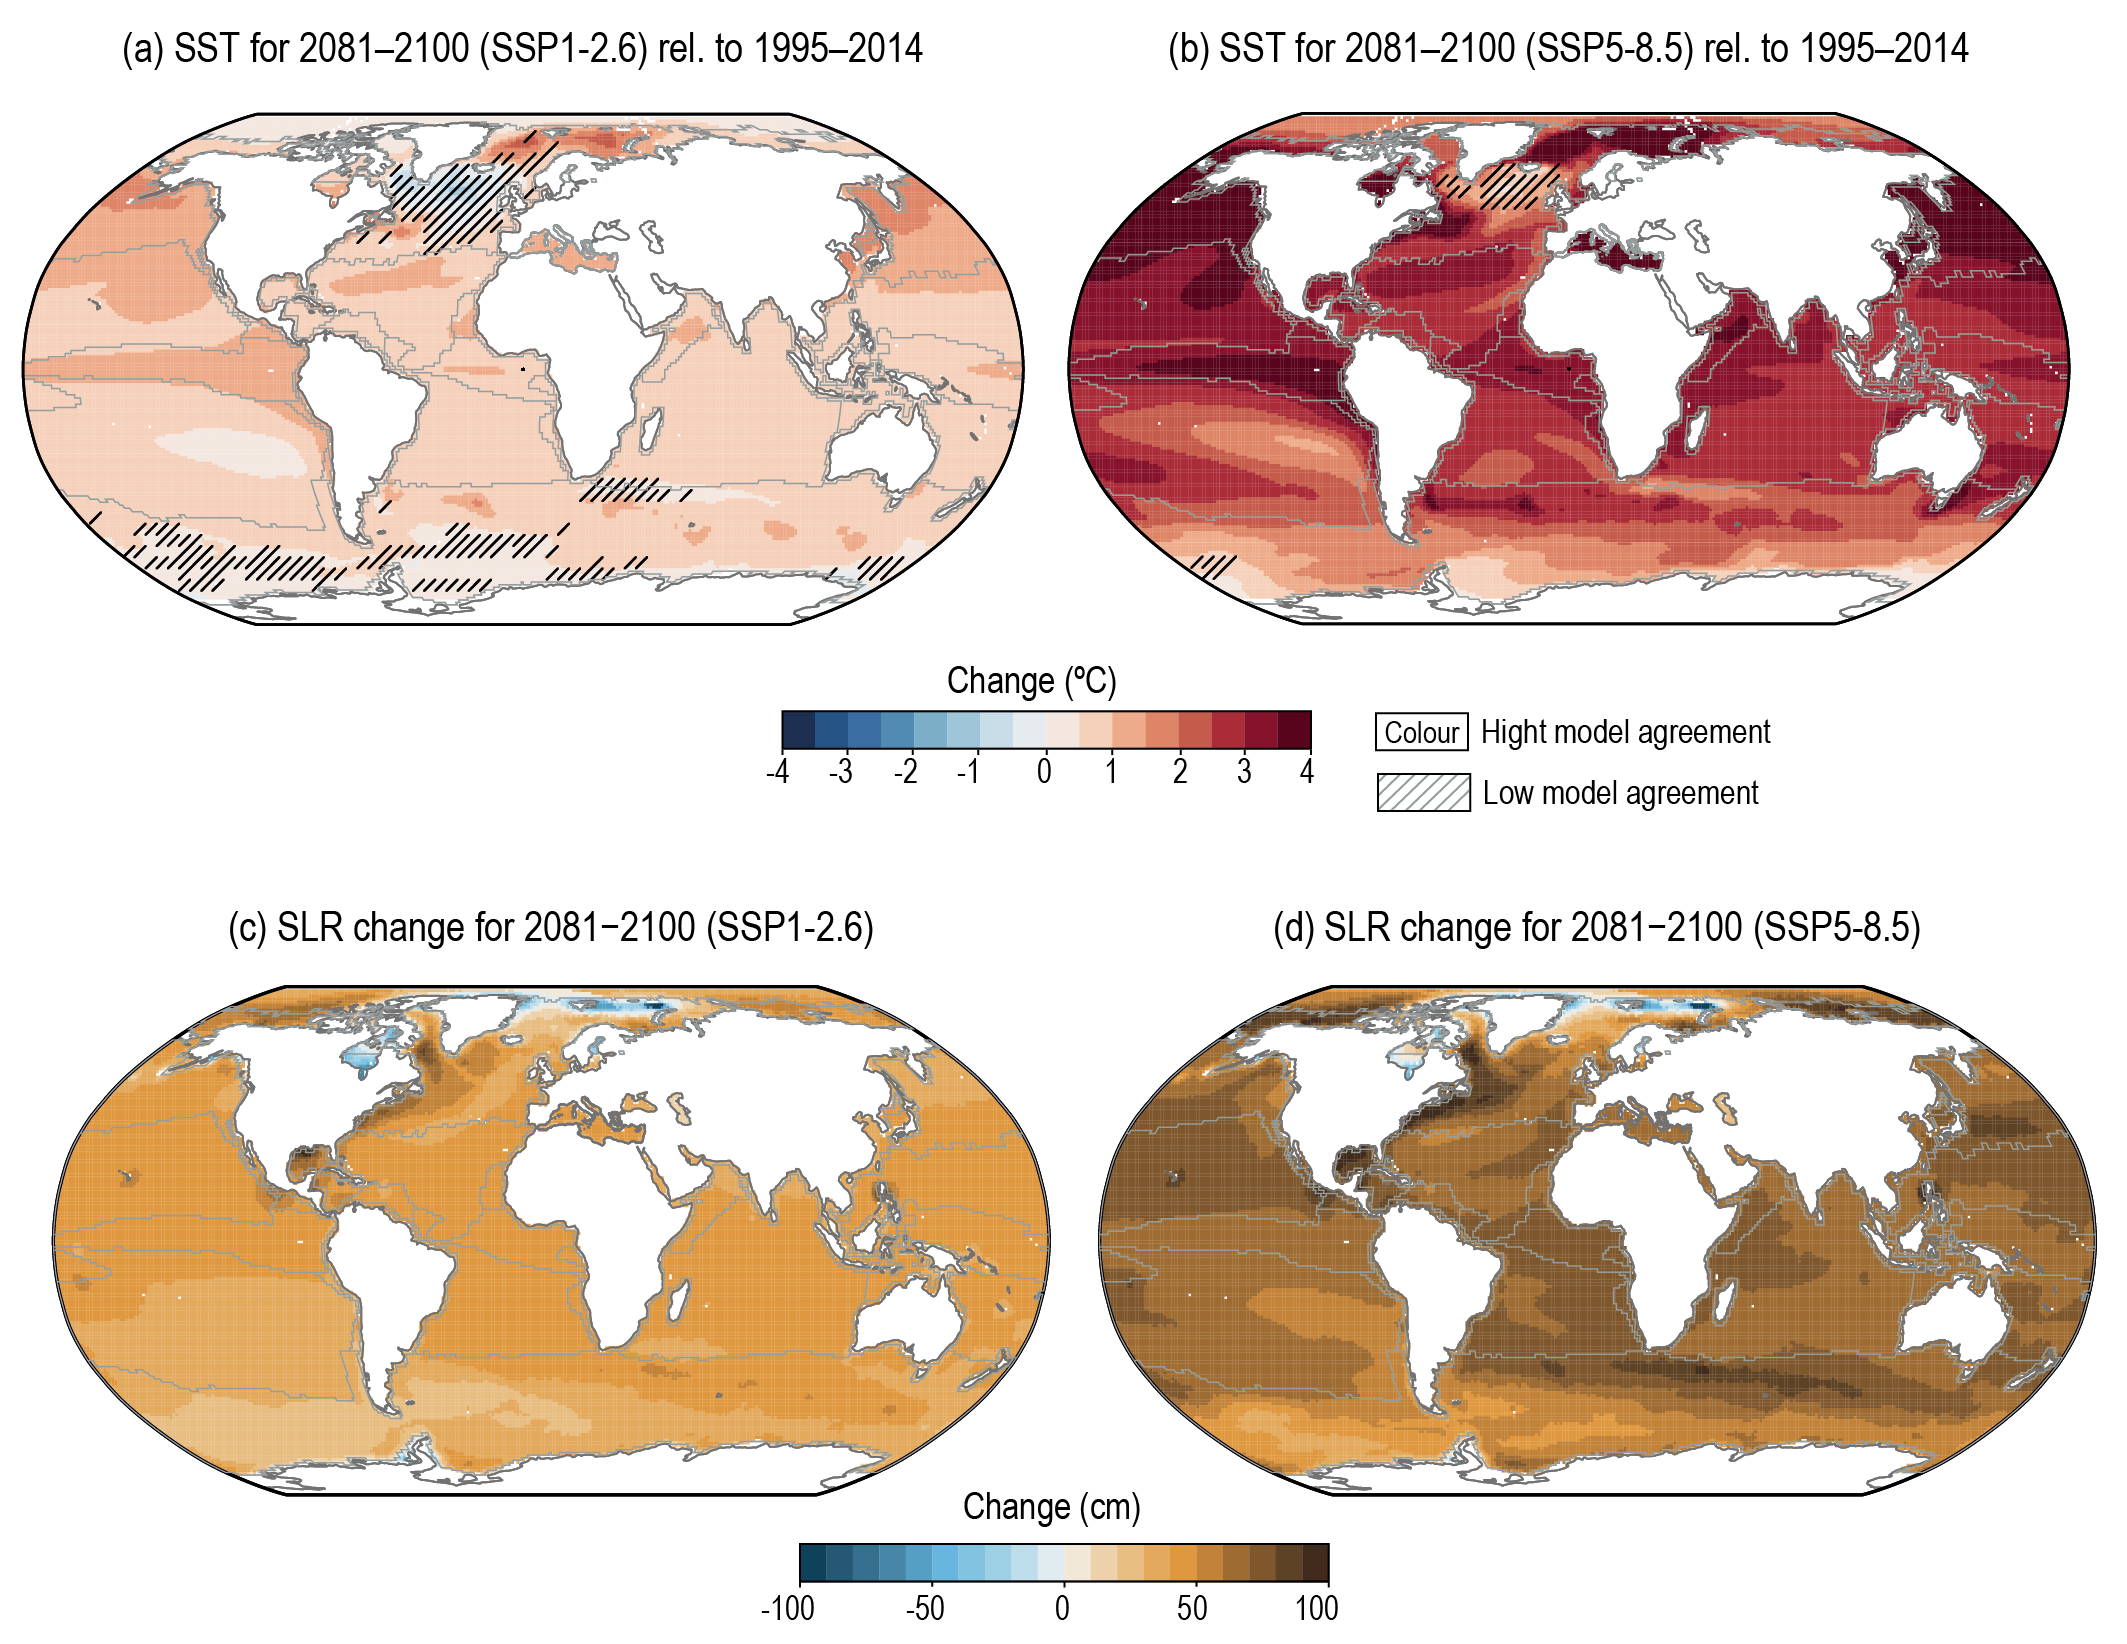
Figure caption
Figure Atlas.12 | Global temperature changes projected for mid-century under SSP1-2.6 (a) and SSP3-7.0 (c) compared with a 2°C global warming level (b) and the end of the century under SSP3-7.0 (d) from the CMIP6 ensemble. Note that the future period warmings are calculated against a baseline period of 1995–2014 whereas the global mean warming level is defined with respect to the baseline period of 1851–1900 used to define global warming levels. The other three SSP-based maps would show greater warmings with respect to this earlier baseline. Further details on data sources and processing are available in the chapter data table (Table Atlas.SM.15).