Back chapter figures
Figure Atlas.13
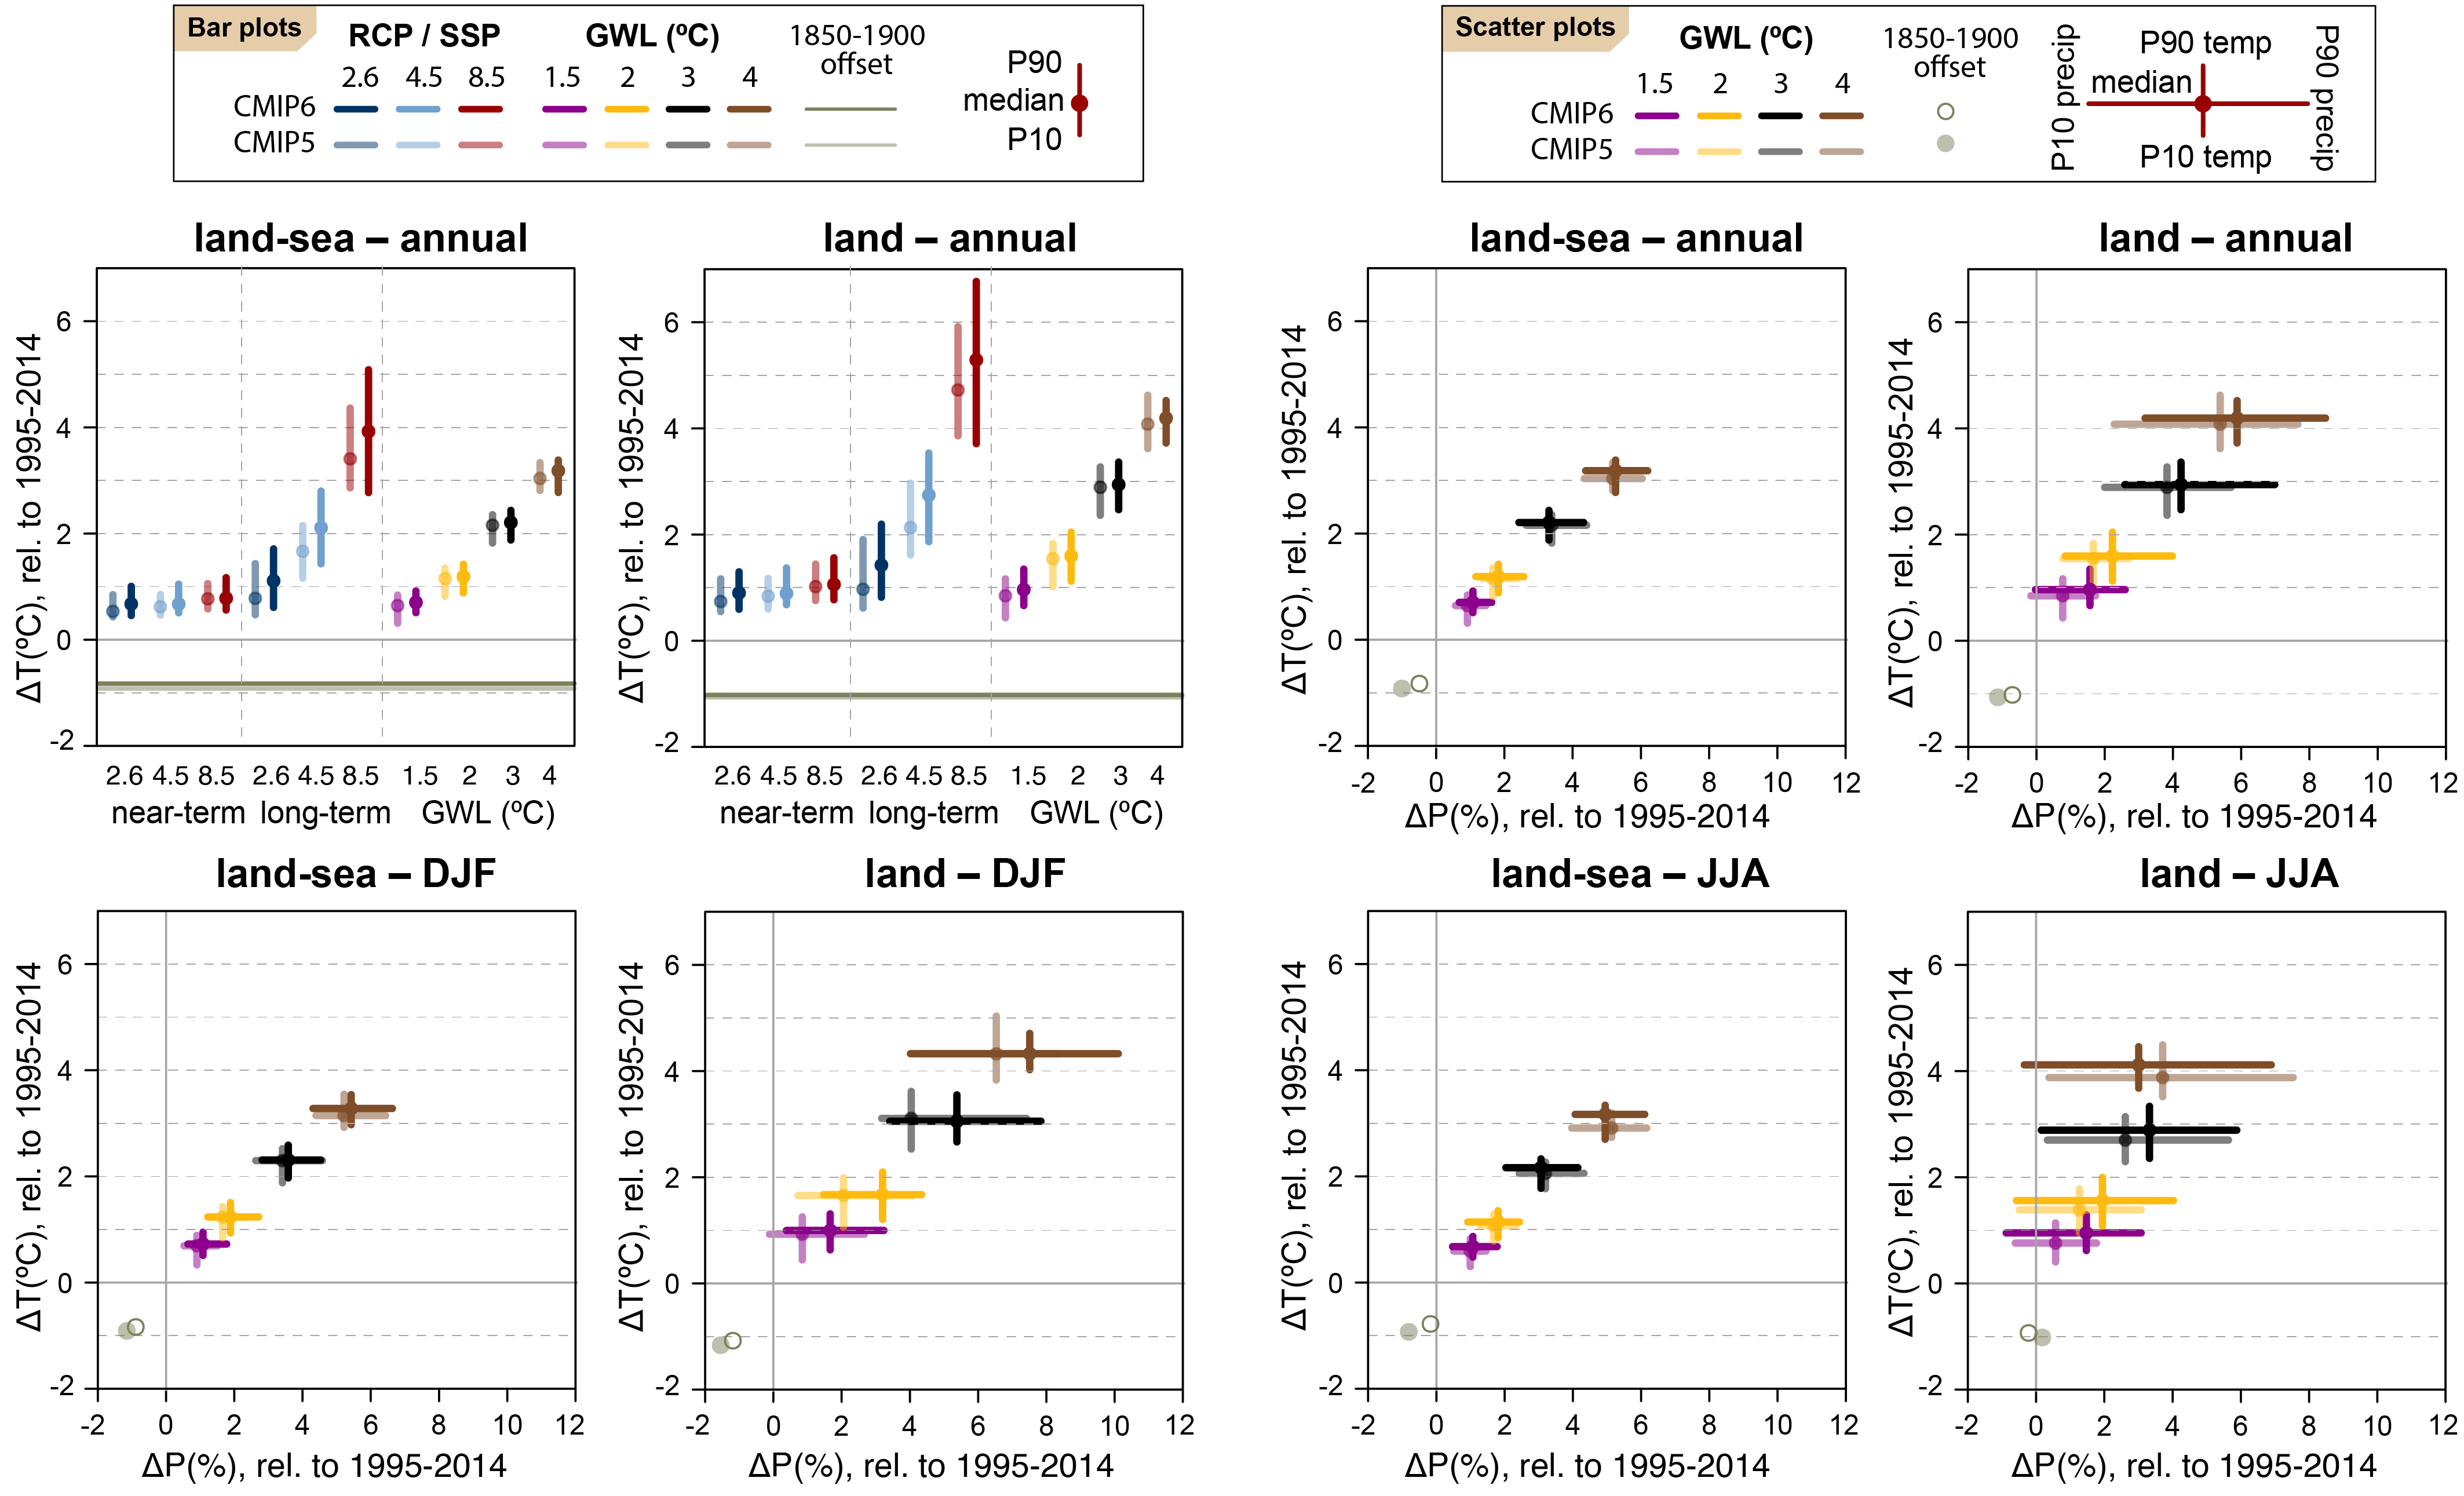
Figure caption
Figure Atlas.13 | Changes in annual mean surface air temperature and precipitation averaged over the global land–sea (left) and global land areas (right) in each horizontal pair of panels. The top-left two panels show the median (dots) and 10th–90th percentile range across each model ensemble for temperature change, for two datasets (CMIP5 and CMIP6) and two scenarios (SSP1-2.6/RCP2.6 and SSP5-8.5/RCP8.5). The first 12 bars represent the projected changes over three time periods (near-term 2021–2040, mid-term 2041–2060 and long-term 2081–2100) compared to the baseline period of 1995–2014, and the remaining four bars represent the additional warming projected relative to the same baseline to reach four global warming levels (GWLs; 1.5°C, 2°C, 3°C and 4°C). The top-right two panels show scatter diagrams of temperature against precipitation changes, displaying the median (dots) and 10th–90th percentile ranges for the same four GWLs, again representing the additional changes for the global temperature to reach the respective GWL from the baseline period of 1995–2014. In all panels the dark (light) grey lines or dots represent the CMIP6 (CMIP5) simulated changes in temperature and precipitation between the 1850–1900 baseline used for calculating GWLs and the recent-past baseline of 1995–2014 used to calculate the changes in the bar diagrams and scatter plots. Changes are absolute for temperature and relative for precipitation. The script used to generate this figure is available online (Iturbide et al., 2021) and similar results can be generated in the Interactive Atlas for flexibly defined seasonal periods. Further details on data sources and processing are available in the chapter data table (Table Atlas.SM.15).