Back chapter figures
Figure Atlas.14
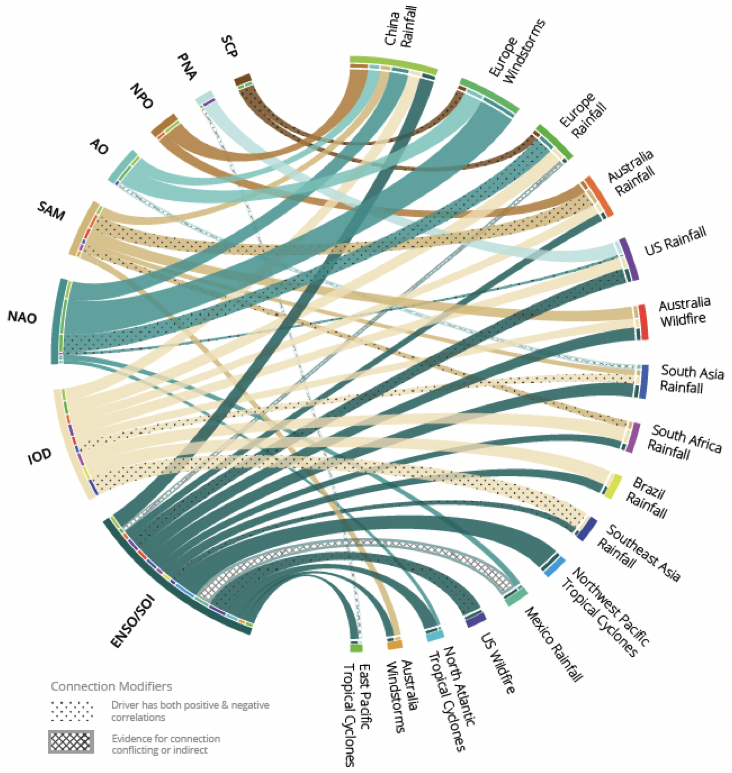
Figure caption
Figure Atlas.14 | Influence of major modes of variability (see Annex IV) on regional extreme events relevant to assessing multi-hazard resilience. Ribbon colours define the driver from which they originate and their width is proportional to the correlation. Crossed lines represent where there is conflicting evidence for a correlation or where the driver is not directly related to the hazard; dots represent drivers that have both a positive and negative correlation with the hazard. Figure is copied from Steptoe et al. (2018) /CCBY4.0.