Back chapter figures
Figure Atlas.15
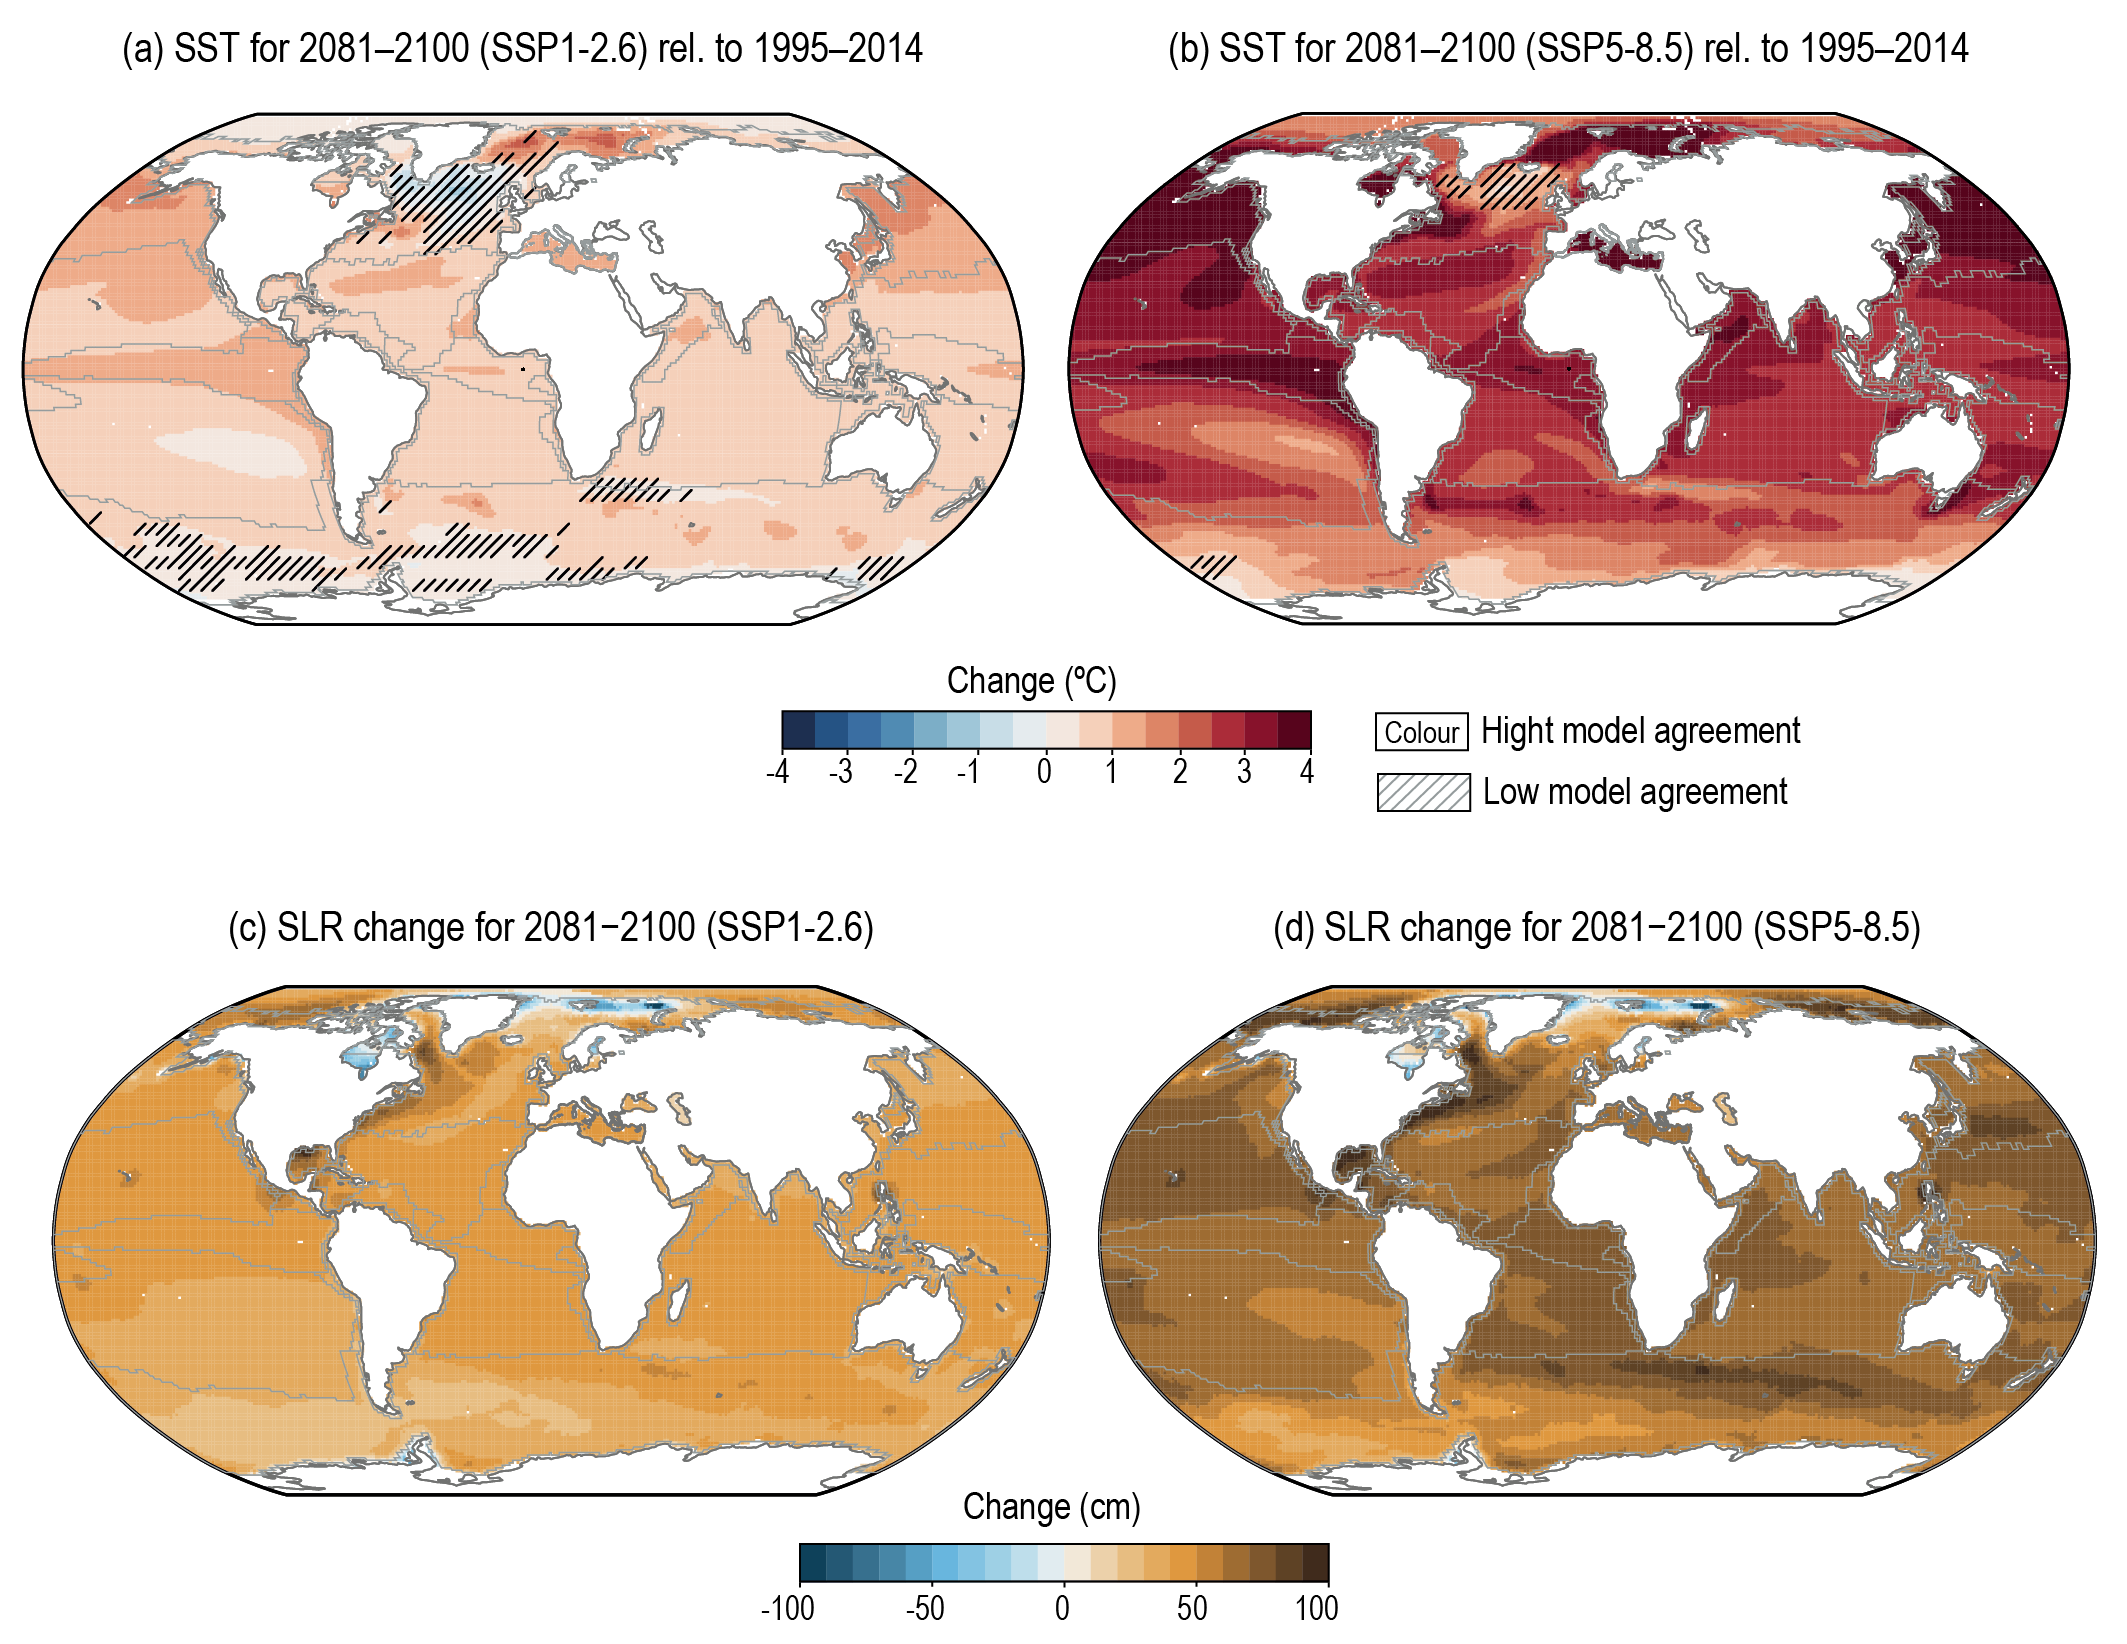
Figure caption
Figure Atlas.15 | Projected changes in sea surface temperature (a.b), sea level rise (c,d) for 2081–2100 under SSP1-2.6 (a,c) and SSP5-8.5 (b,d) emissions scenarios compared to a 1995–2014 baseline period from the CMIP6 ensemble. For sea surface temperature, diagonal lines indicate regions where 80% of the models do not agree on the sign of the projected changes. Further details on data sources and processing are available in the chapter data table (Table Atlas.SM.15).