Back chapter figures
Figure Atlas.18
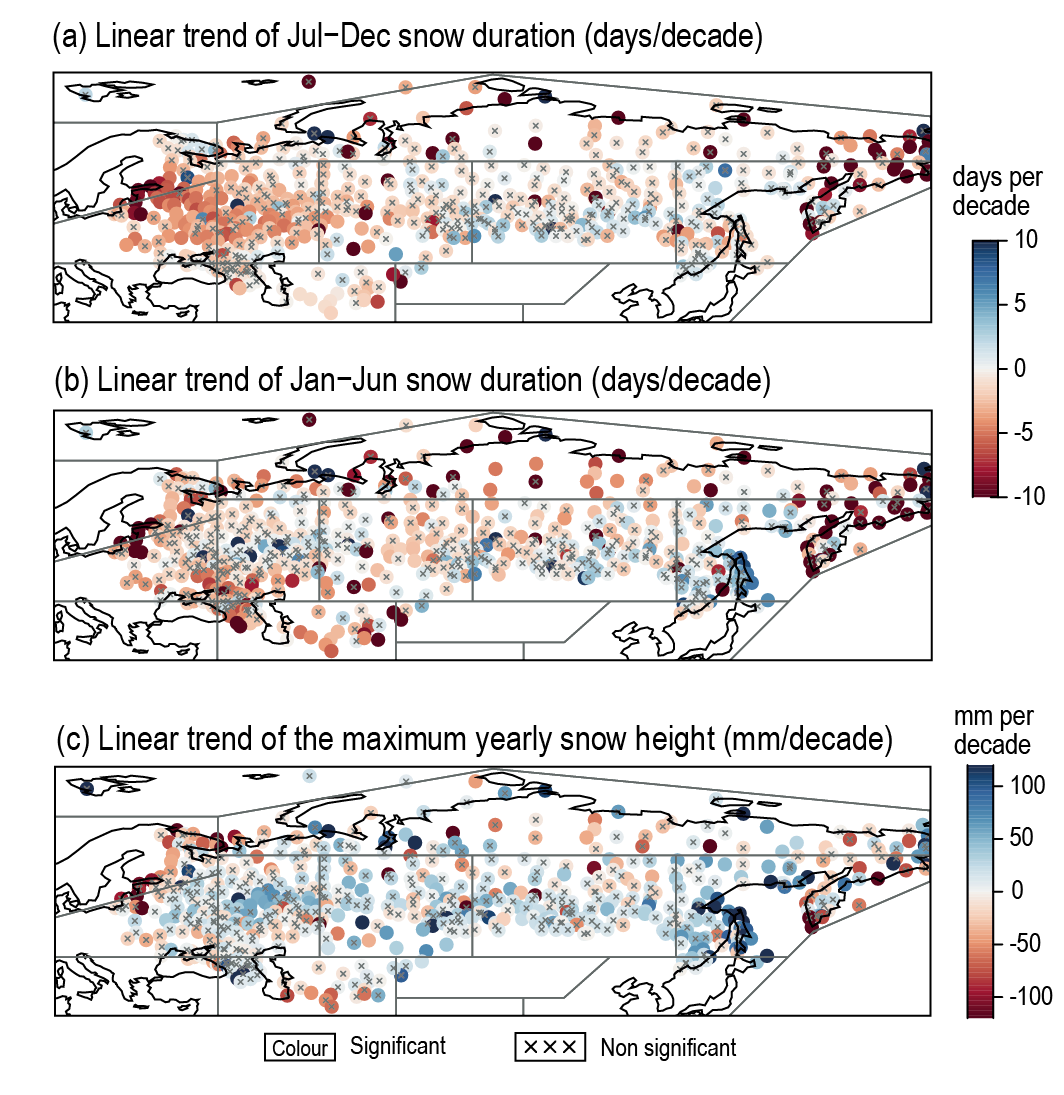
Figure caption
Figure Atlas.18 | Linear trends for the 1980–2015 period based on station data from the World Data Centre of the Russian Institute for Hydrometeorological Information (RIHMI-WDC; Bulygina et al., 2014). (a) Snow-season duration from 1 July to 31 December (days per decade); (b) snow-season duration from 1 January to 30 June (days per decade); (c) maximum annual height of snow cover (mm per decade). Trends have been calculated using ordinary least squares regression and the crosses indicate non-significant trend values (at the 0.1 level) following the method of Santer et al. (2008) to account for serial correlation. Further details on data sources and processing are available in the chapter data table (Table Atlas.SM.15).