Back chapter figures
Figure Atlas.20
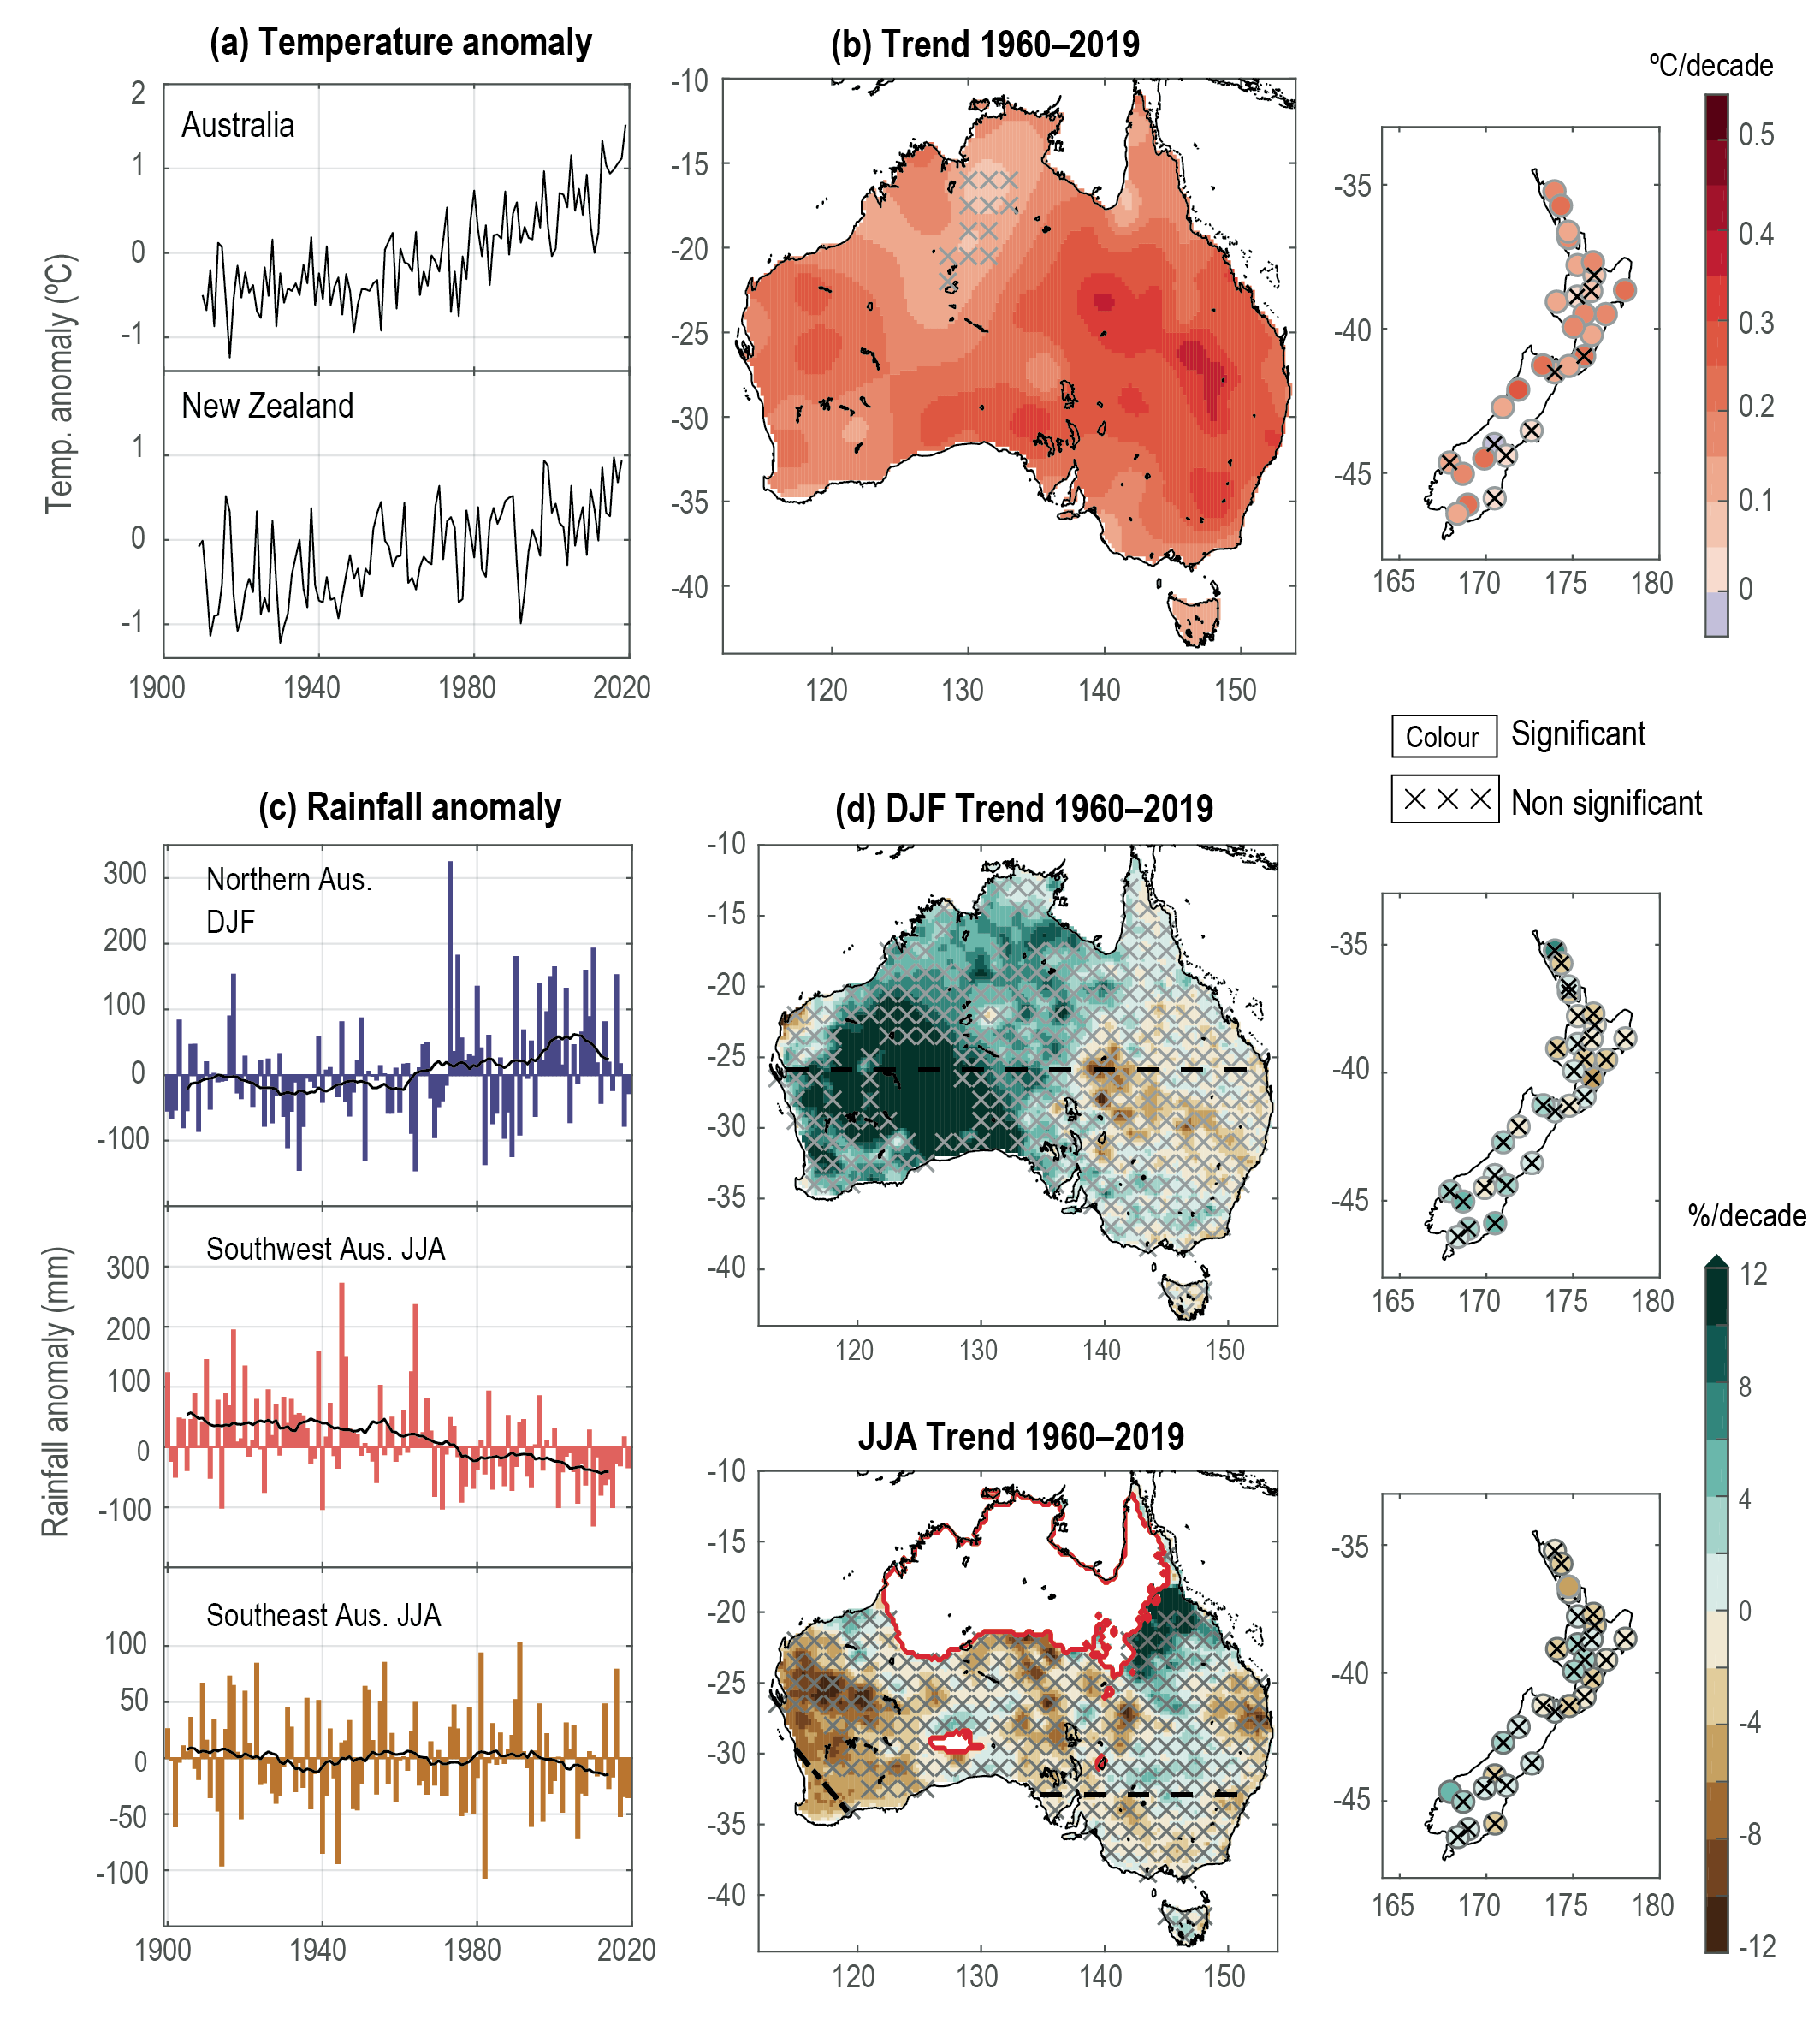
Figure caption
Figure Atlas.20 | Observed trends in mean annual temperature (a, b) and summer (December–January–February, DJF) and winter (June–July–August, JJA) precipitation (c, d) for Australia and New Zealand from high-quality regional datasets. Time series show anomalies from the 1961–1990 average and 10-year running mean; maps show annual linear trends for 1960–2019; rainfall trends are shown in % per decade, crosses show areas and stations with a lack of significant trend and regions of seasonally dry conditions (<0.25 mm day–1) are masked and outlined in red. Datasets are Australian Climate Observation Reference Network – Surface Air Temperature version 2.1 (ACORN-SATv2.1) for Australian temperature, the Australian Gridded Climate Data (AGCD) for Australian rainfall (Evans et al., 2020), and the 30-station high-quality network for New Zealand temperature and rainfall. Further details on data sources and processing are available in the chapter data table (Table Atlas.SM.15).