Back chapter figures
Figure Atlas.23
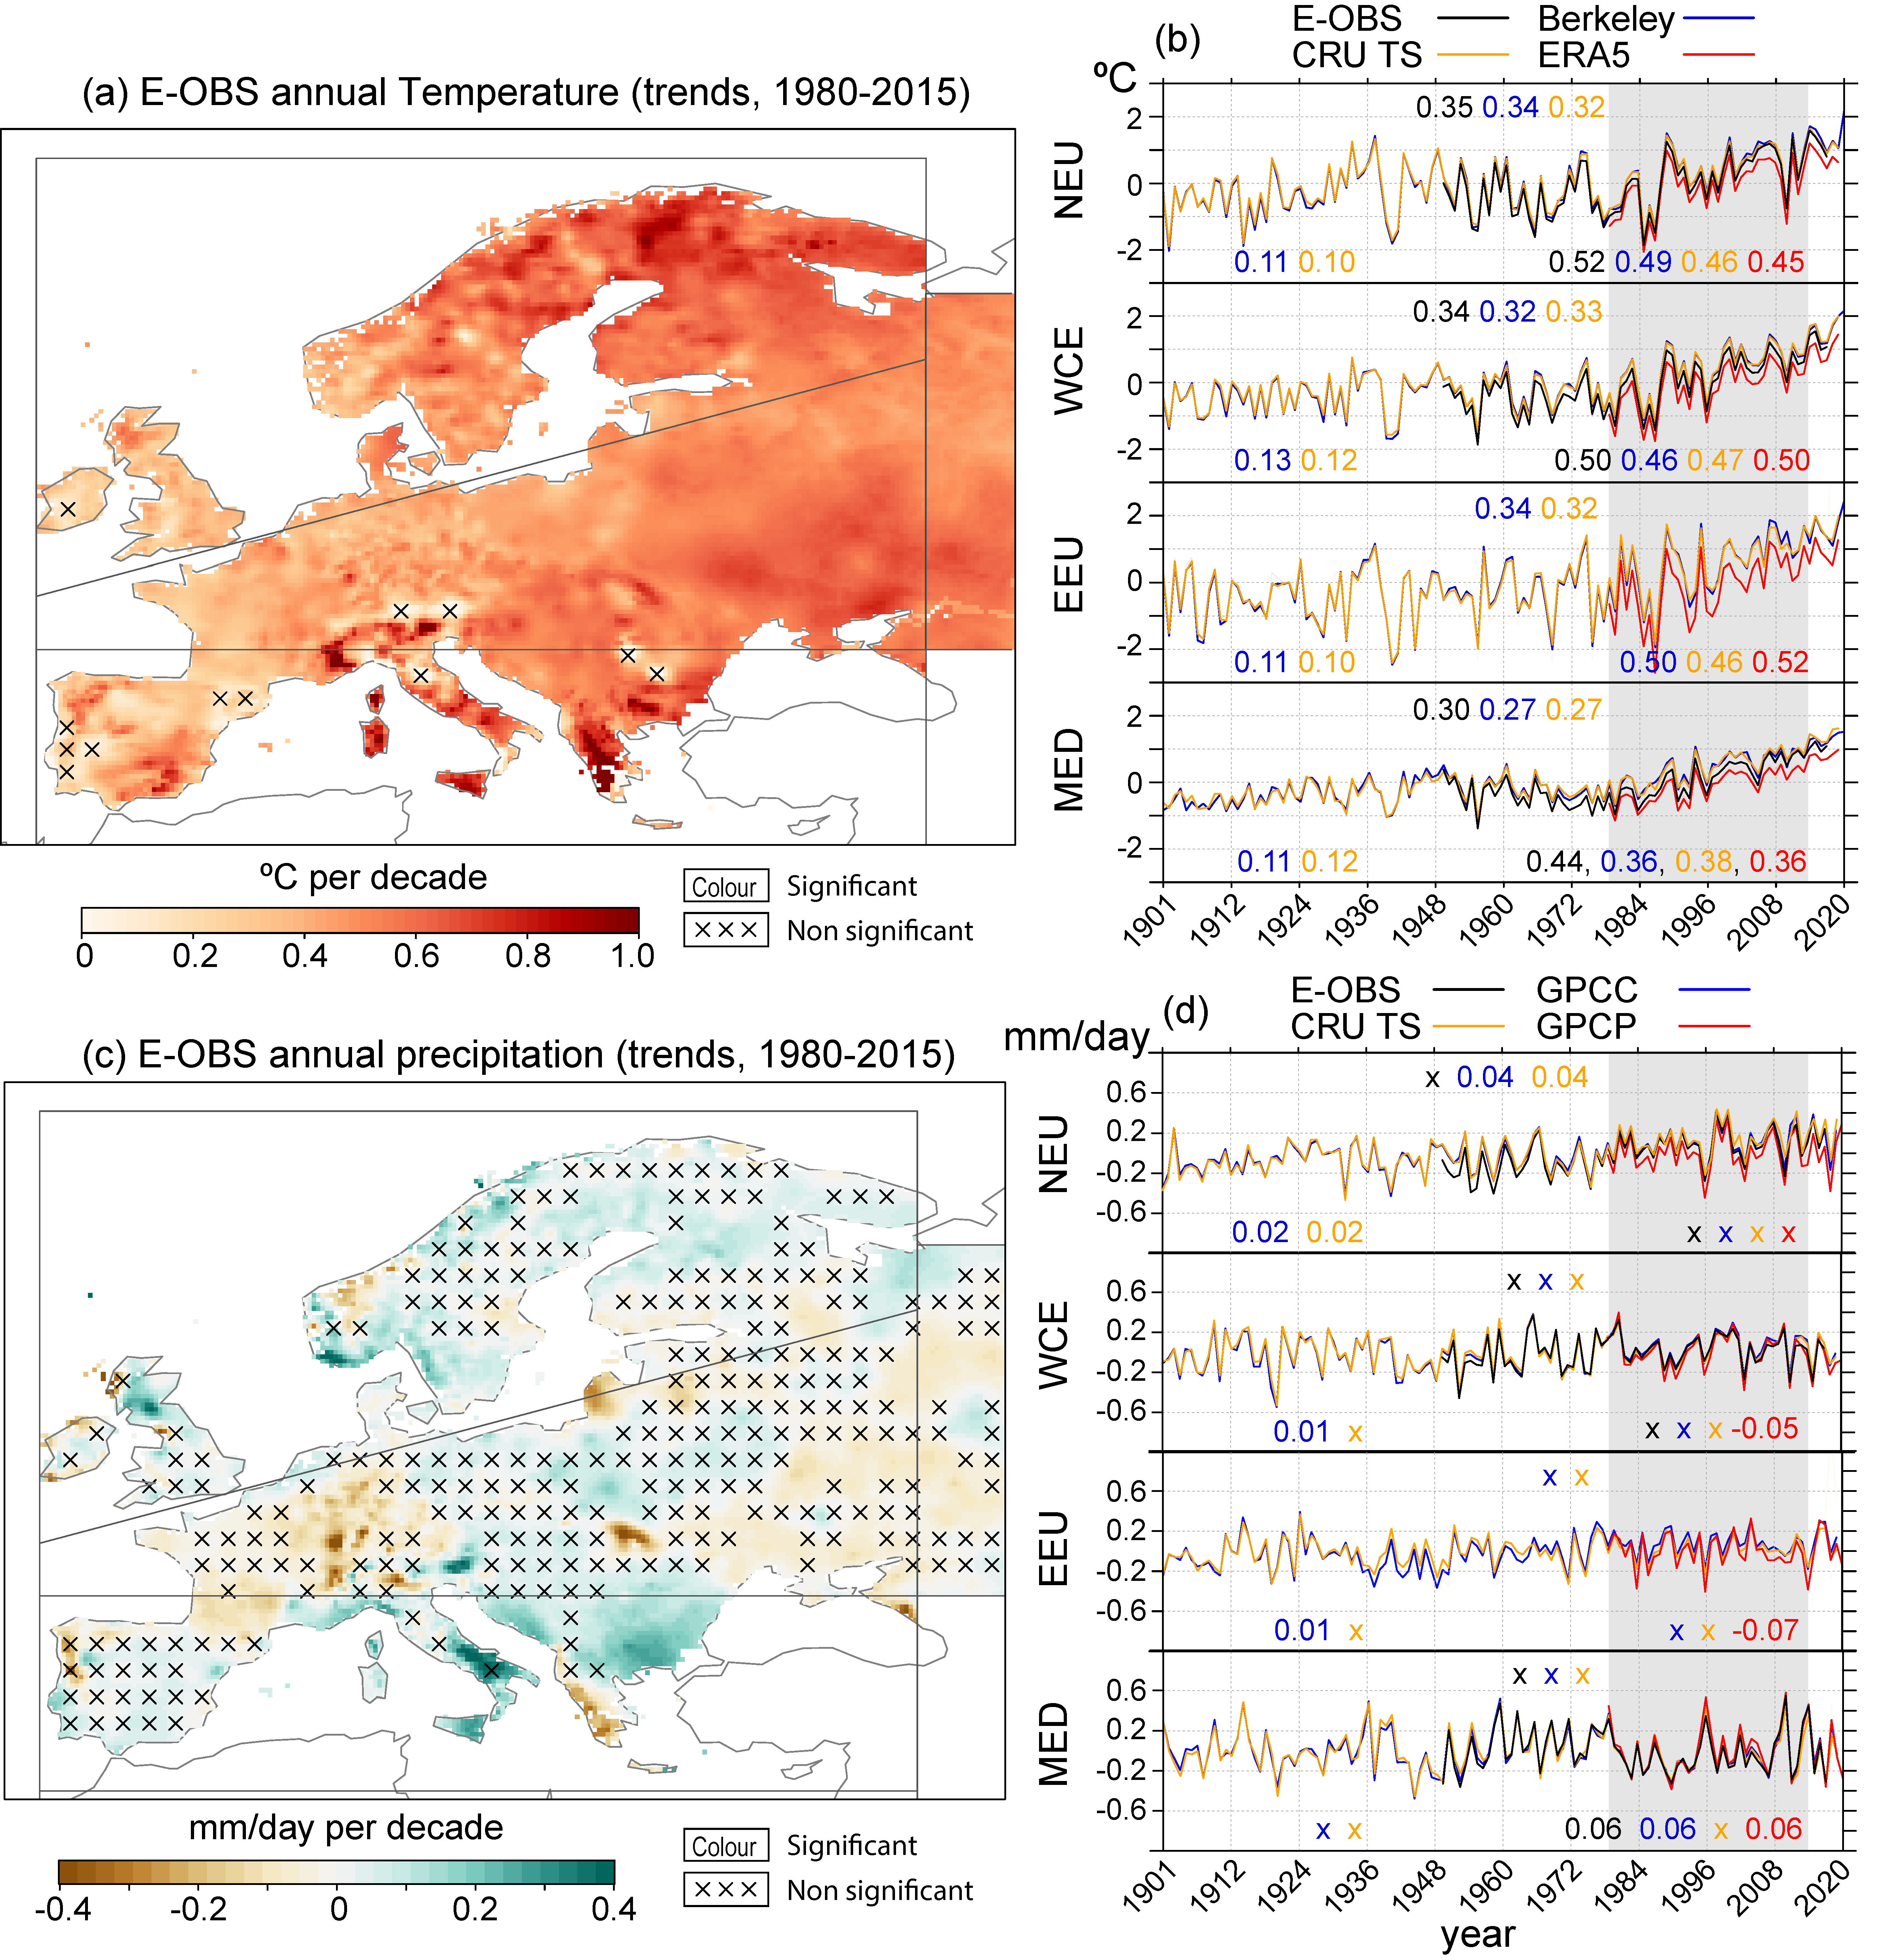
Figure caption
Figure Atlas.23 | (a) Mean 1980–2015 trend ofannual mean surface air temperature (°C per decade) from E-OBS (Cornes et al., 2018). Data for non-European countries in the MED area are masked out. (b) Time series of mean annual temperature anomaly relative to the 1980–2015 period (shown with grey shading) aggregated for the land area in each of the four European sub-regions, from E-OBS, CRU, Berkeley and ERA5 (see Atlas.1.4.1 for description of global datasets). Mean trends for 1901–2015, 1961–2015 and 1980–2015 are shown for each dataset in corresponding colours in the same units as panel (a) (see legend in upper panel). (c) As panel (a) for annual mean precipitation (mm day–1per decade). (d) As panel (b) for annual mean precipitation, from datasets E-OBS, CRU, GPCC and GPCP. Note that E-OBS data are not shown in panels (b) and (d) for the region EEU. For the MED region data are aggregated over the European countries alone. Trends have been calculated using ordinary least squares regression and the crosses indicate non-significant trend values (at the 0.1 level) following the method of Santer et al. (2008) to account for serial correlation. Further details on data sources and processing are available in the chapter data table (Table Atlas.SM.15).