Back chapter figures
Figure Atlas.5
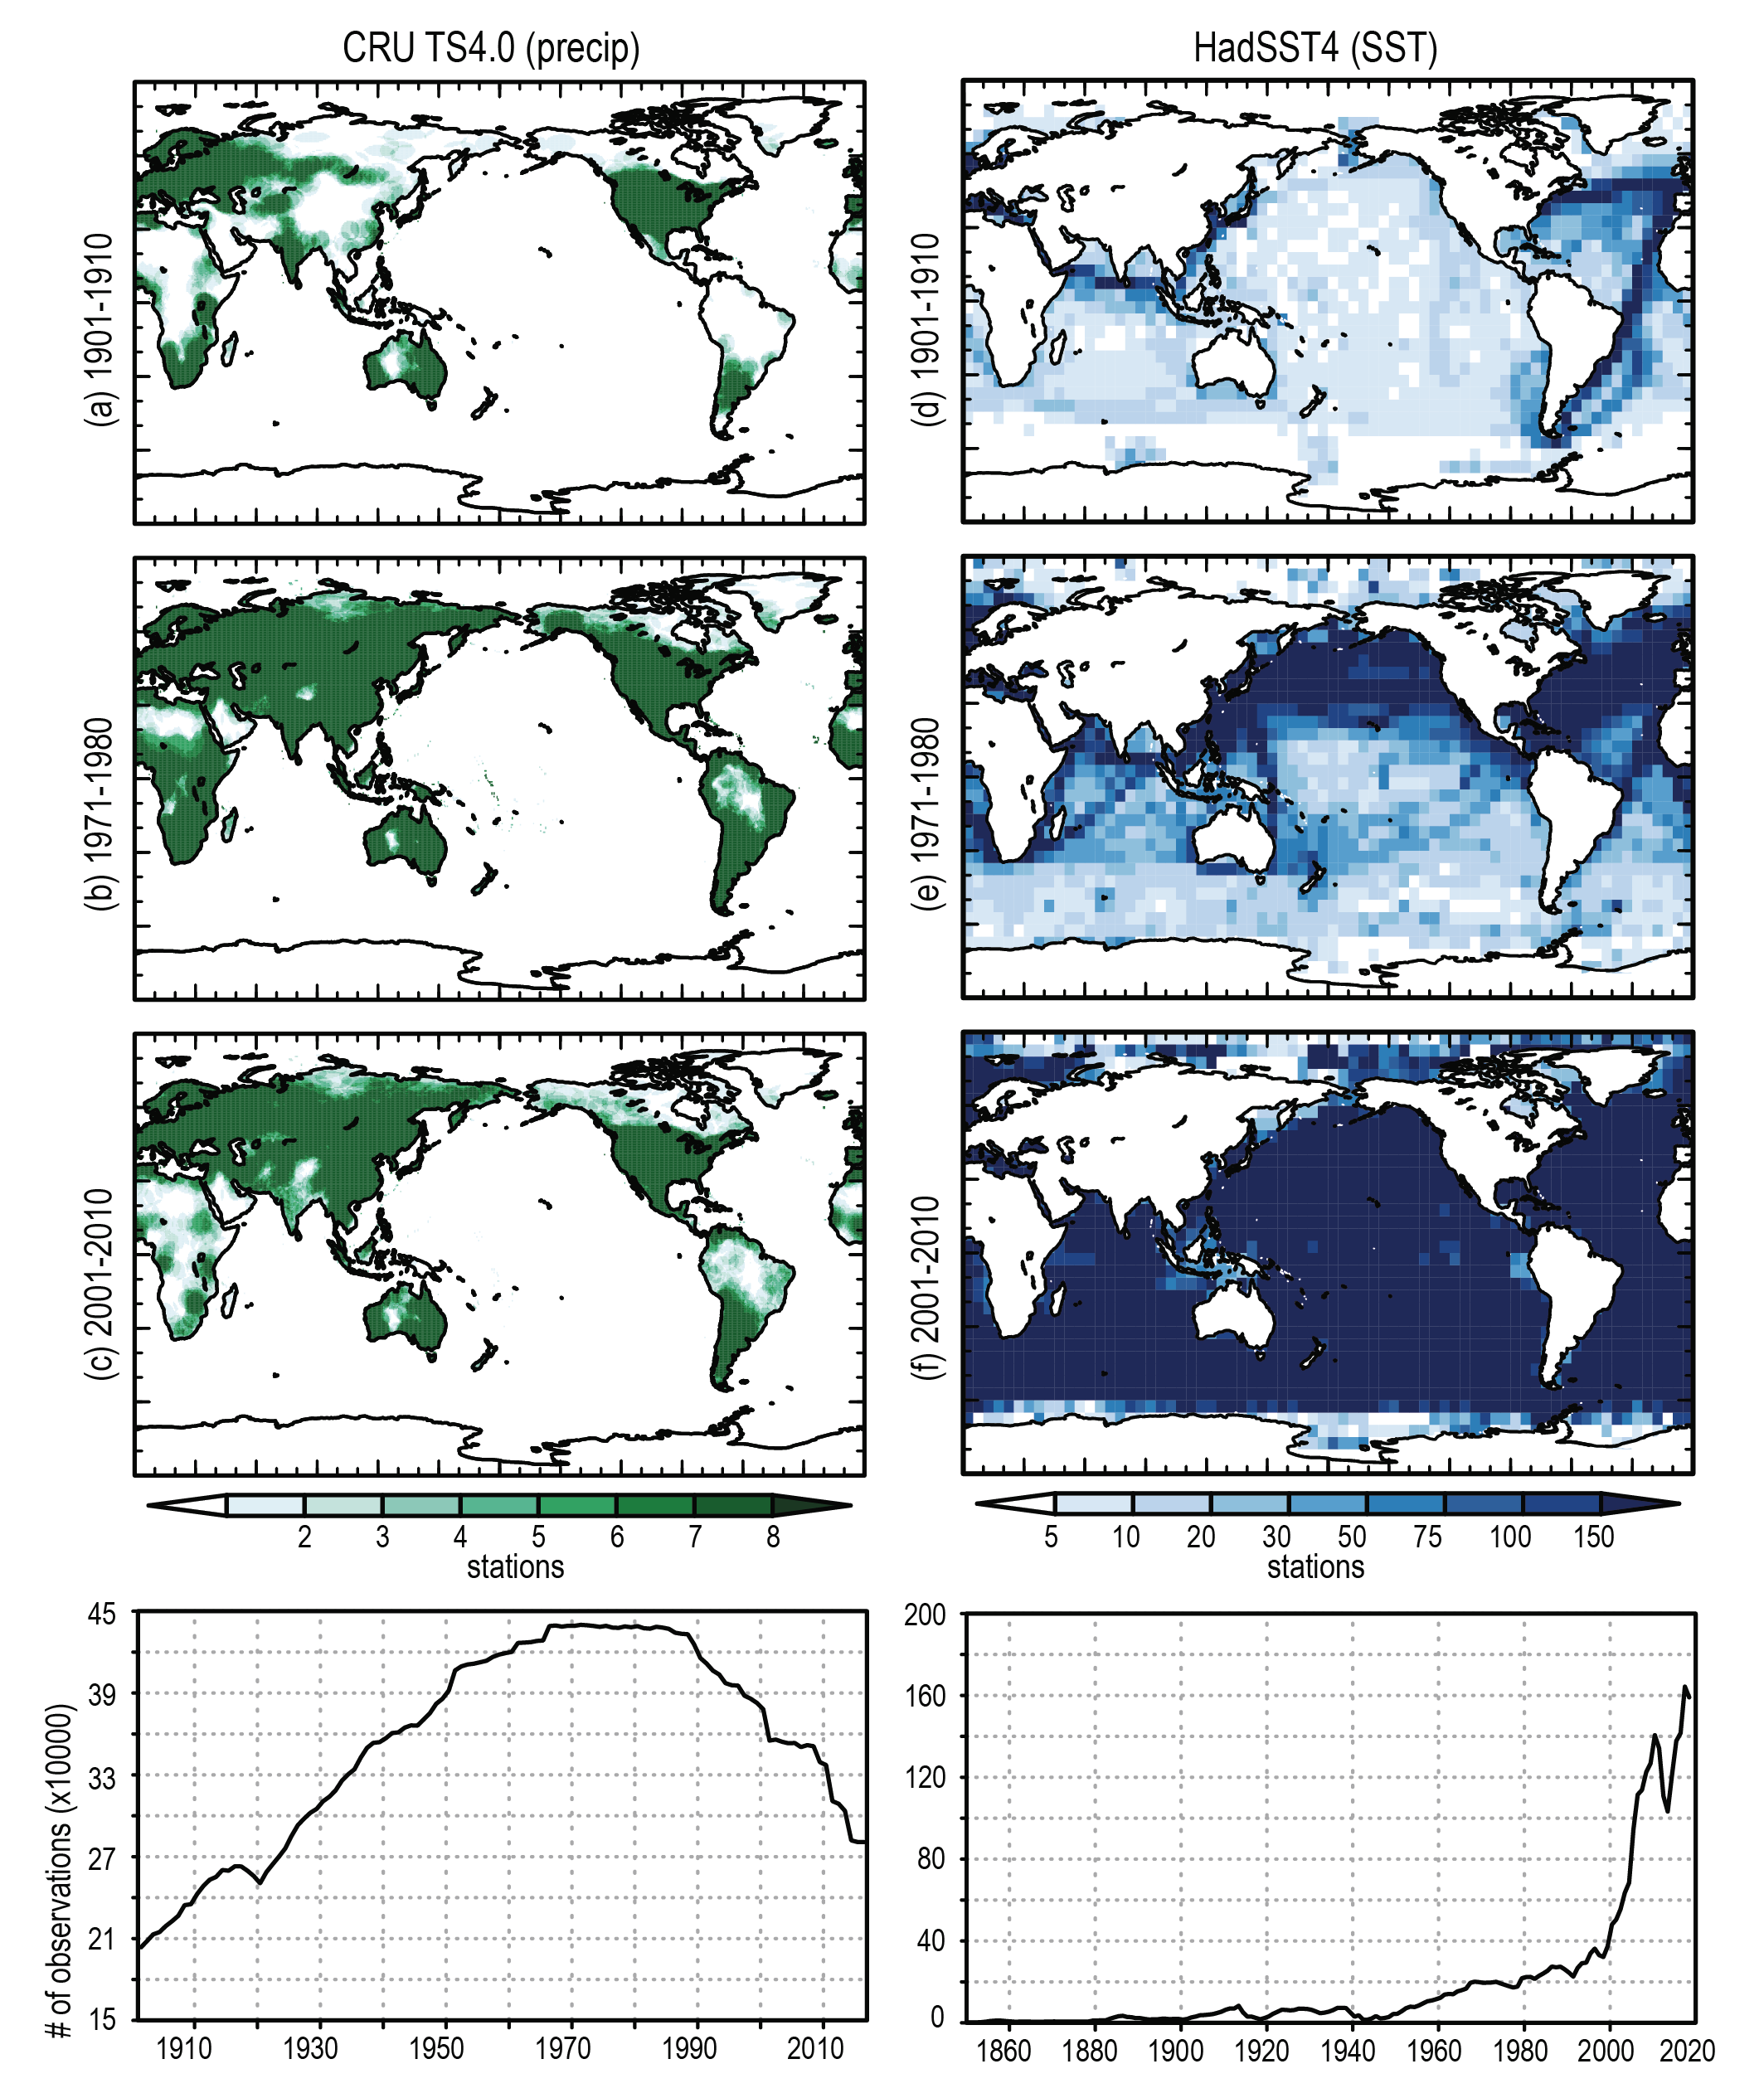
Figure caption
Figure Atlas.5 | Number of stations per 0.5° × 0.5° gridcell reported over the periods of 1901–1910, 1971–1980, and 2001–2010 (rows 1–3), and the global total number of stations reported over the entire globe (bottom row) for precipitation in the CRU TS4 dataset (left) and the HadSST4 dataset (right). Further details on data sources and processing are available in the chapter data table (Table Atlas.SM.15).