Back chapter figures
Figure Atlas.7
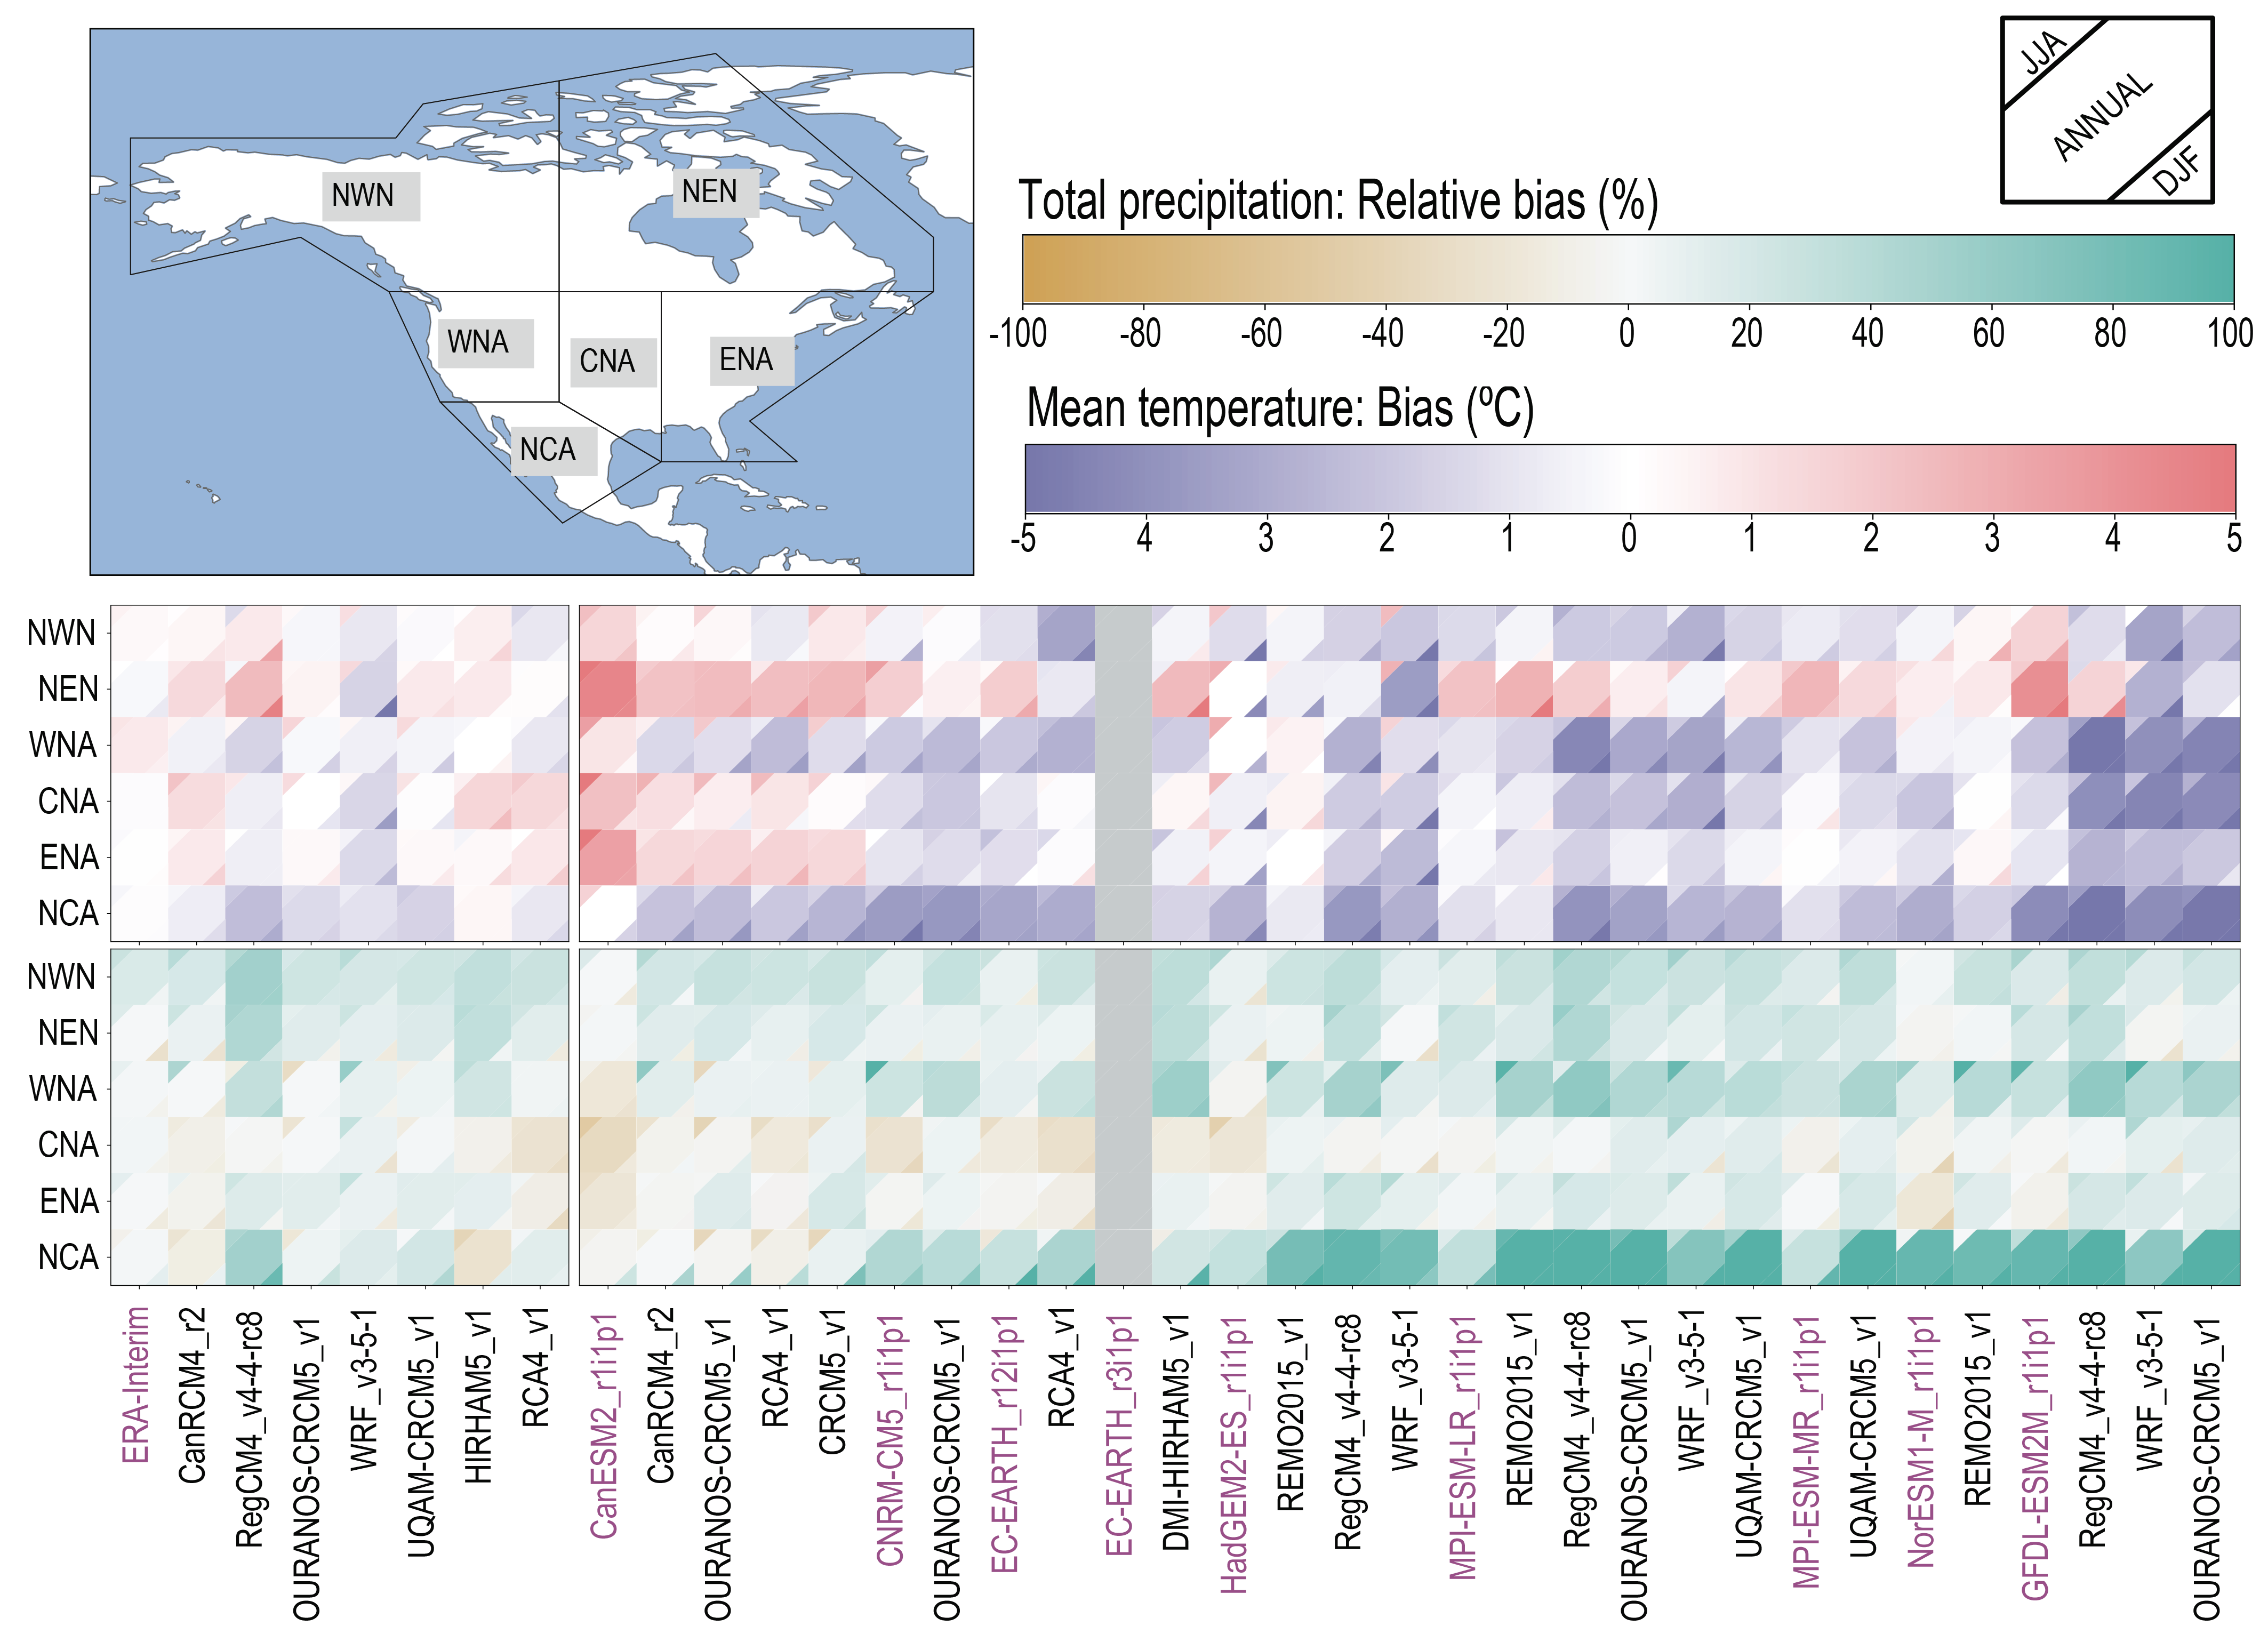
Figure caption
Figure Atlas.7 | Evaluation of annual and seasonal air temperature and precipitation for the six North America sub-regions, NWN, NEN, WNA, CNA, ENA and NCA (land only) for CORDEX-NAM RCM simulations driven by reanalysis or historical GCMs. Seasons are June–July–August (JJA) and December–January–February (DJF). Rows represent sub-regions and columns correspond to the models. Magenta text indicates the driving historical CMIP5 GCMs (including ERA-Interim in the first set of slightly separated columns) and the black text to the right of the magenta text represents the driven RCMs. The colour matrices show the mean spatial biases; all biases have been computed for the period 1985–2005 relative to the observational reference (E5W5, see Atlas.1.4.2). Further details on data sources and processing are available in the chapter data table (Table Atlas.SM.15).