Back chapter figures
Figure Atlas.9
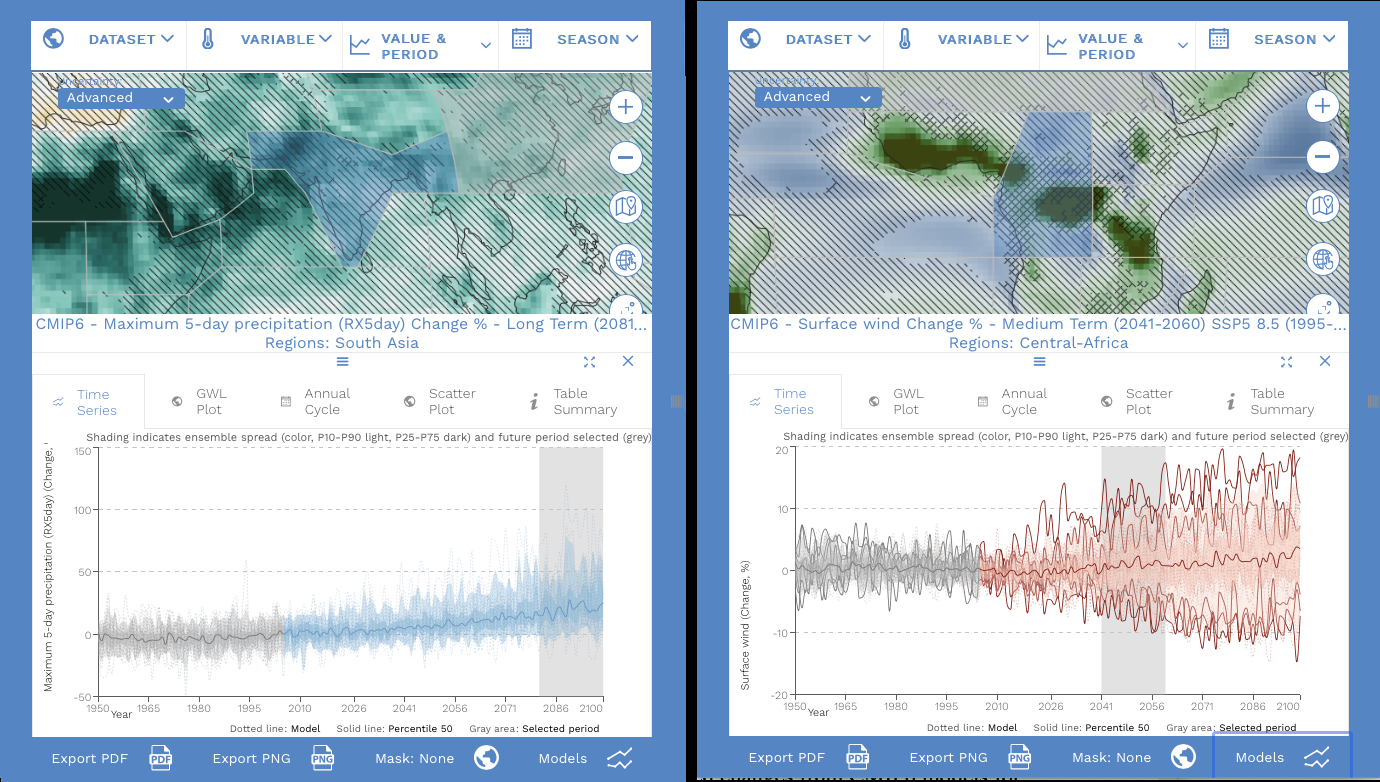
Figure caption
Figure Atlas.9 | Analysing robustness and uncertainty in climate change signals across spatial scales using the Interactive Atlas. The left panel shows projected annual relative changes for maximum five-day precipitation from CMIP6 for 2081–2100 relative to a 1995-2014 baseline under the SSP3-7.0 scenario, through a map of the ensemble-mean changes (panel top) and information on the regional aggregated signal over the South Asia reference region as a time series (panel bottom). This shows non-robust changes (diagonal lines) at the grid-box level (due to the large local variability), but a robust aggregated signal over the region. The right panel shows projected surface wind-speed changes from CMIP6 models for 2041–2060 relative to a 1995–2014 baseline under the SSP5-8.5 scenario, again with the ensemble-mean changes in the map (panel top) and a regionally aggregated time series over Central Africa for each model (panel bottom). This shows conflicting changes (crossed lines) at the grid-box level due to signals of opposite sign in the individual models displayed in the time series.