Cross-Chapter Box 1.4, Figure 1
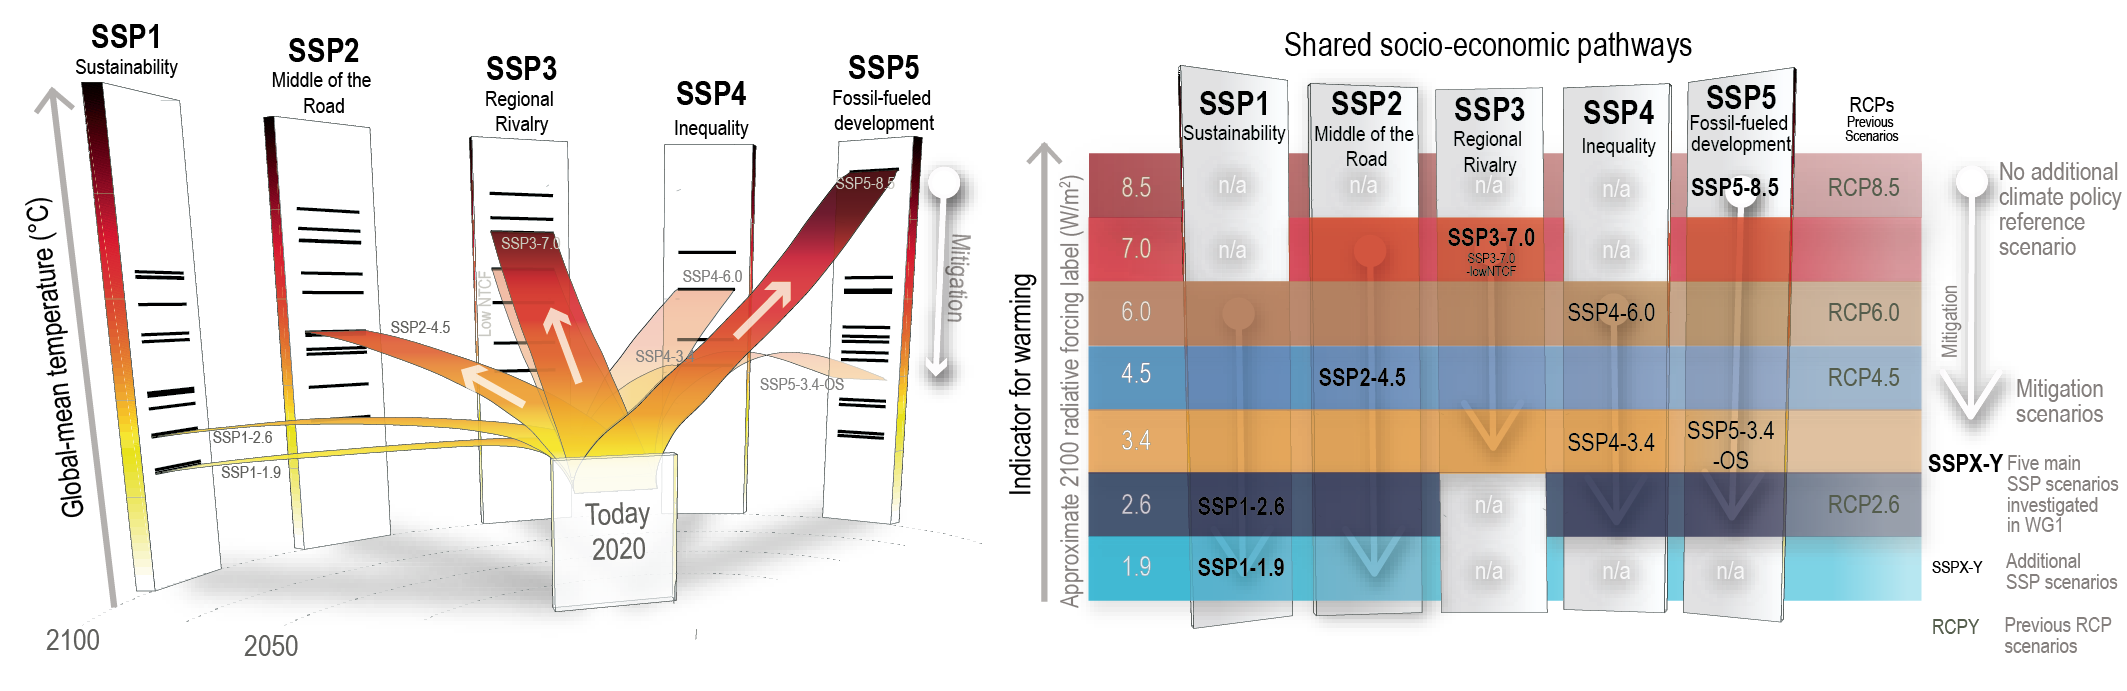
Figure caption
Cross-Chapter Box 1.4, Figure 1 | The SSP scenarios used in this Report, their indicative temperature evolution and radiative forcing categorization, and the five socio-economic storylines upon which they are built. The core set of scenarios used in this report – i.e., SSP1-1.9, SSP1-2.6, SSP2-4.5, SSP3-7.0 and SSP5-8.5 – is shown together with an additional four SSPs that are part of ScenarioMIP, as well as previous RCP scenarios. In The left-hand panel, the indicative temperature evolution is shown (adapted fromMeinshausen et al. , 2020). The black stripes on the respective scenario family panels on the left-hand side indicate a larger set of IAM-based SSP scenarios that span the scenario range more fully, but are not used in this report. The SSP–radiative forcing matrix is shown on The right-hand panel, with the SSP socio-economic narratives shown as columns and the indicative radiative forcing categorization by 2100 shown as rows. Note that the descriptive labels for the five SSP narratives refer mainly to the reference scenario futures without additional climate policies. For example, SSP5 can accommodate strong mitigation scenarios leading to net zero emissions; these do not match a ‘fossil-fuelled development’ label. Further details on data sources and processing are available in the chapter data table (Table 1.SM.1).