Cross-Chapter Box 1.4, Figure 2
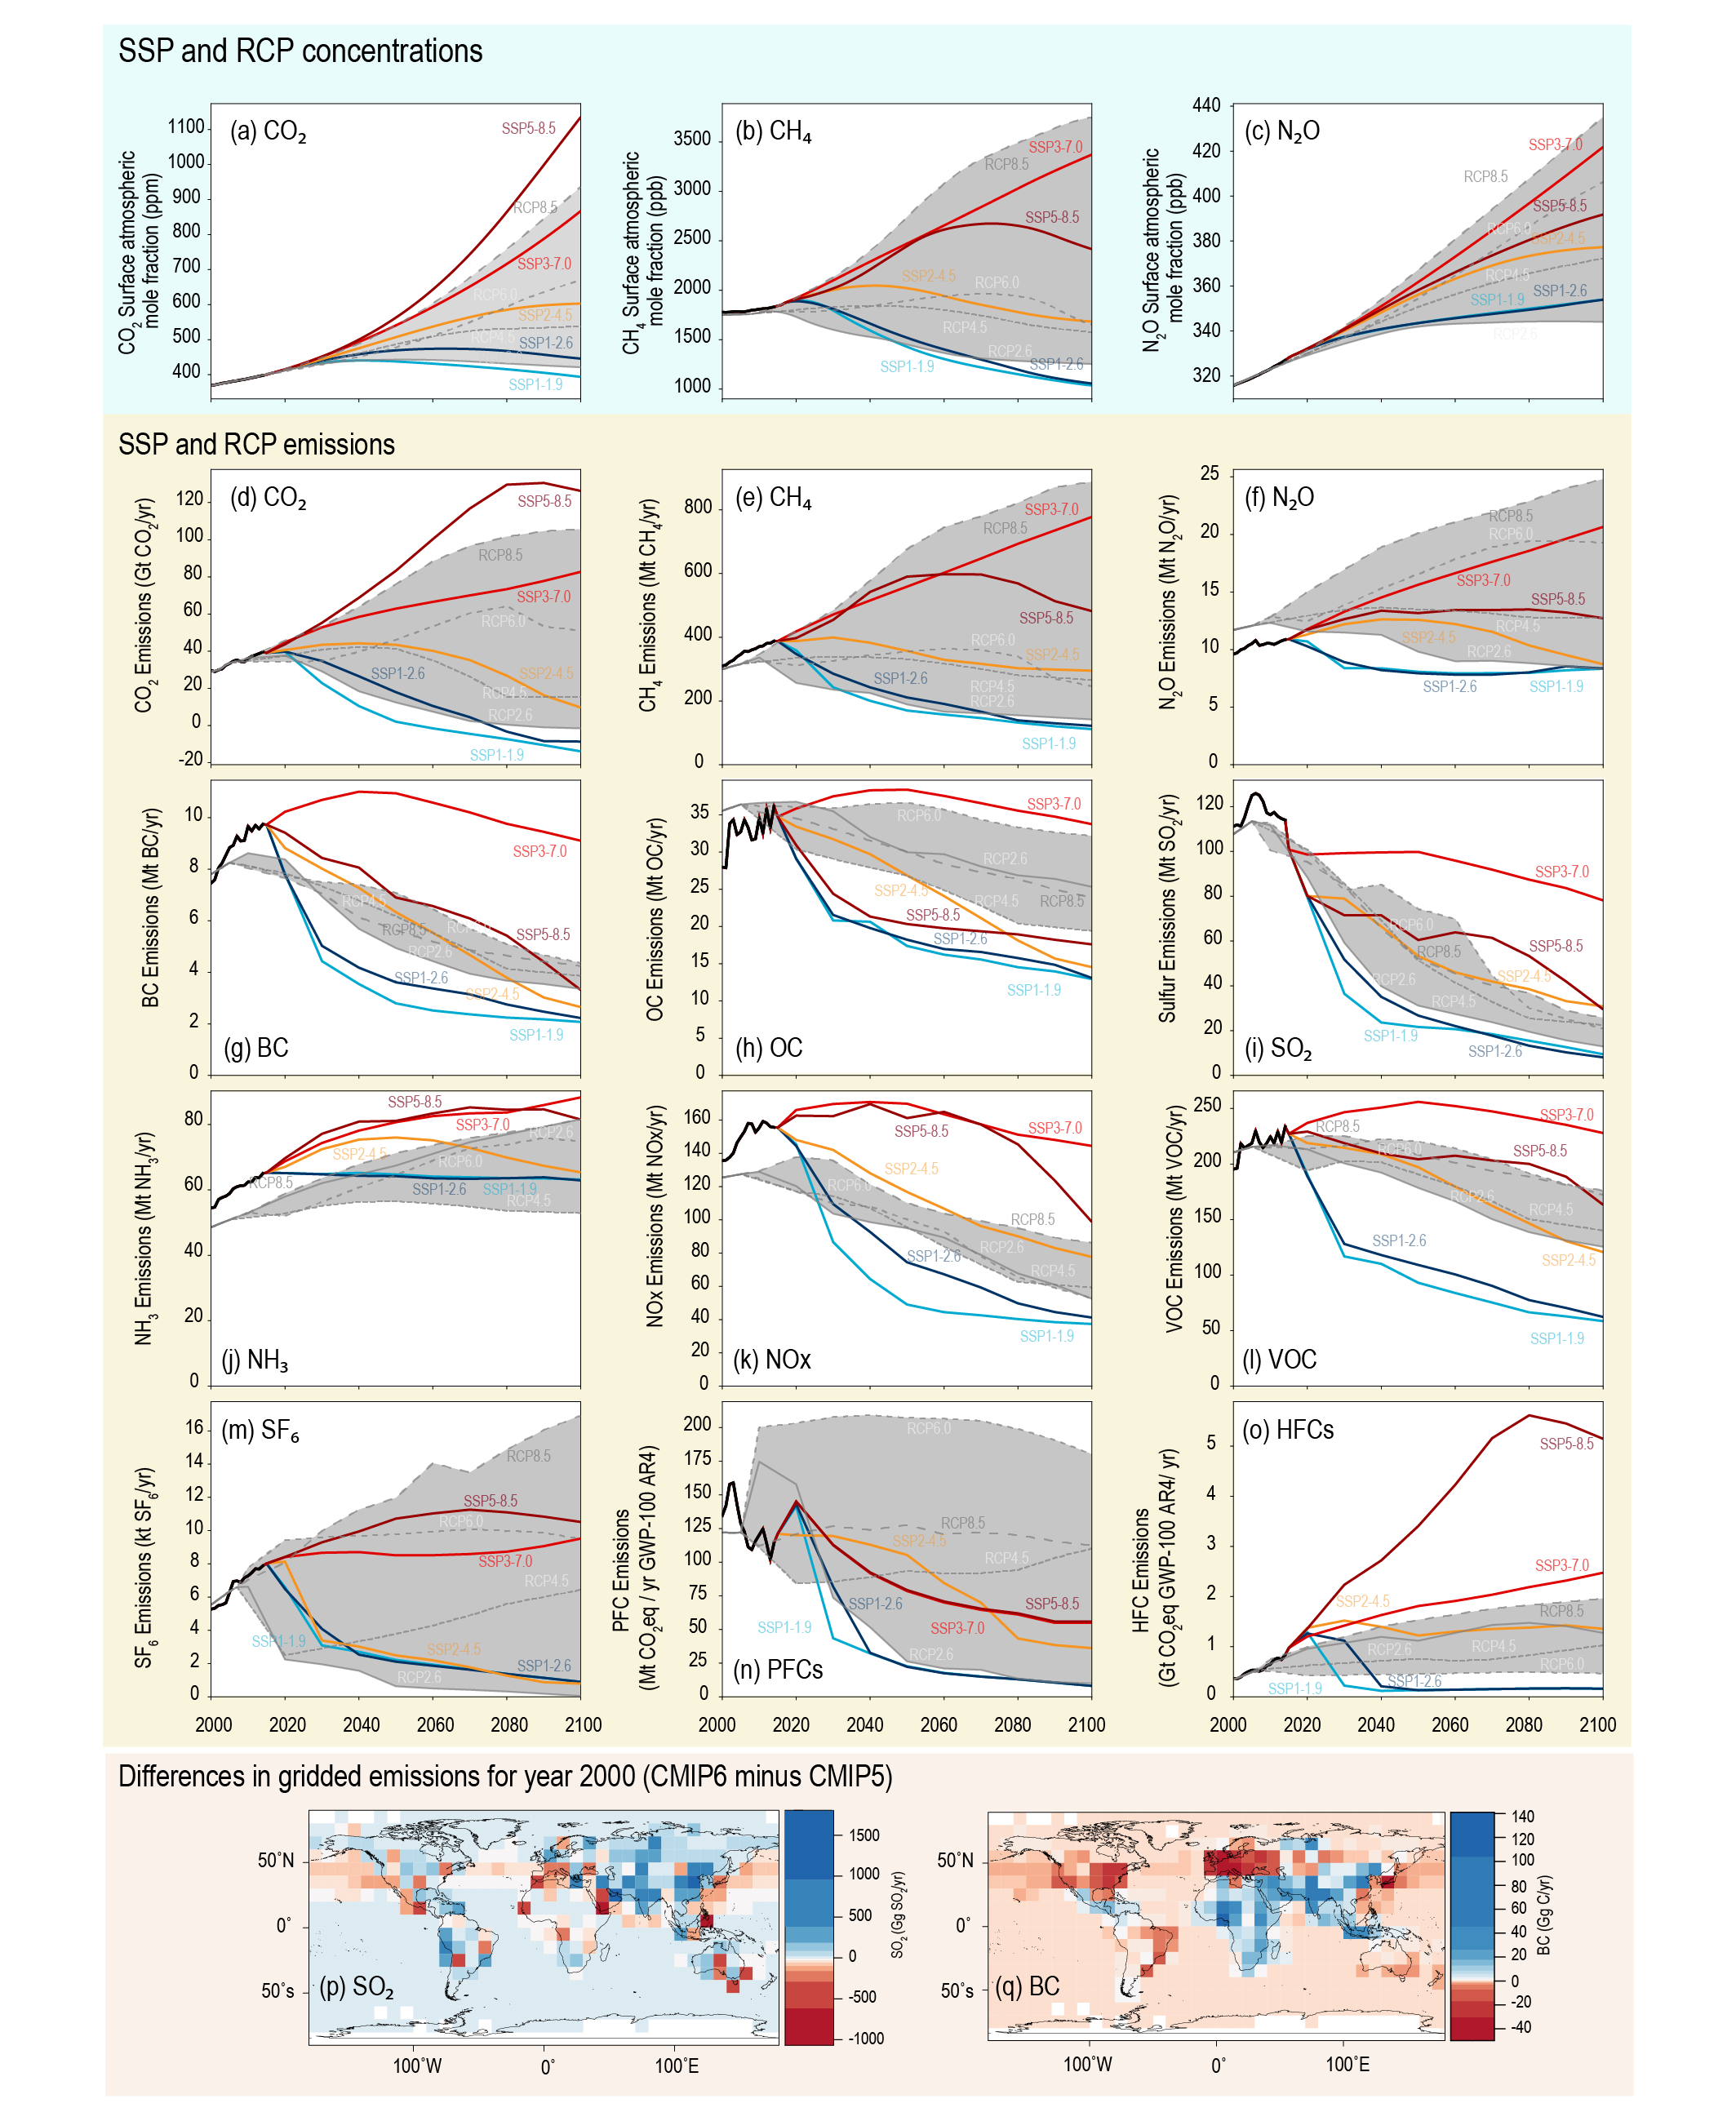
Figure caption
Cross-Chapter Box 1.4, Figure 2 | Comparison between the Shared Socio-economic Pathways (SSP) scenarios and the Representative Concentration Pathway (RCP) scenarios in terms of their CO2 , CH4 and N2 O atmospheric concentrations (a–c), and their global emissions of CO2 , CH4 , N2 O, black carbon (BC), organic carbon (OC), sulphur dioxide (SO2 ), ammonia (NH3 ), nitrogen oxides (NOx), volatile organic compounds (VOC), sulphur hexafluoride (SF6), perfluorocarbons (PFCs), and hydrofluorocarbons (HFCs) (d–o). Cross-Chapter Box 1.4, Figure 2: Also shown are gridded emissions differences for SO2 (p) and black carbon (q) for the year 2000 between the input emissions datasets that underpinned the CMIP5 and CMIP6 model intercomparisons. Historical emissions estimates are provided in black in panels (d–o). The range of concentrations and emissions investigated under the RCP pathways is shaded grey. Panels (p) and (q) adapted from Figure 7 in Hoesly et al. (2018). Further details on data sources and processing are available in the chapter data table (Table 1.SM.1).