FAQ 1.2, Figure 1
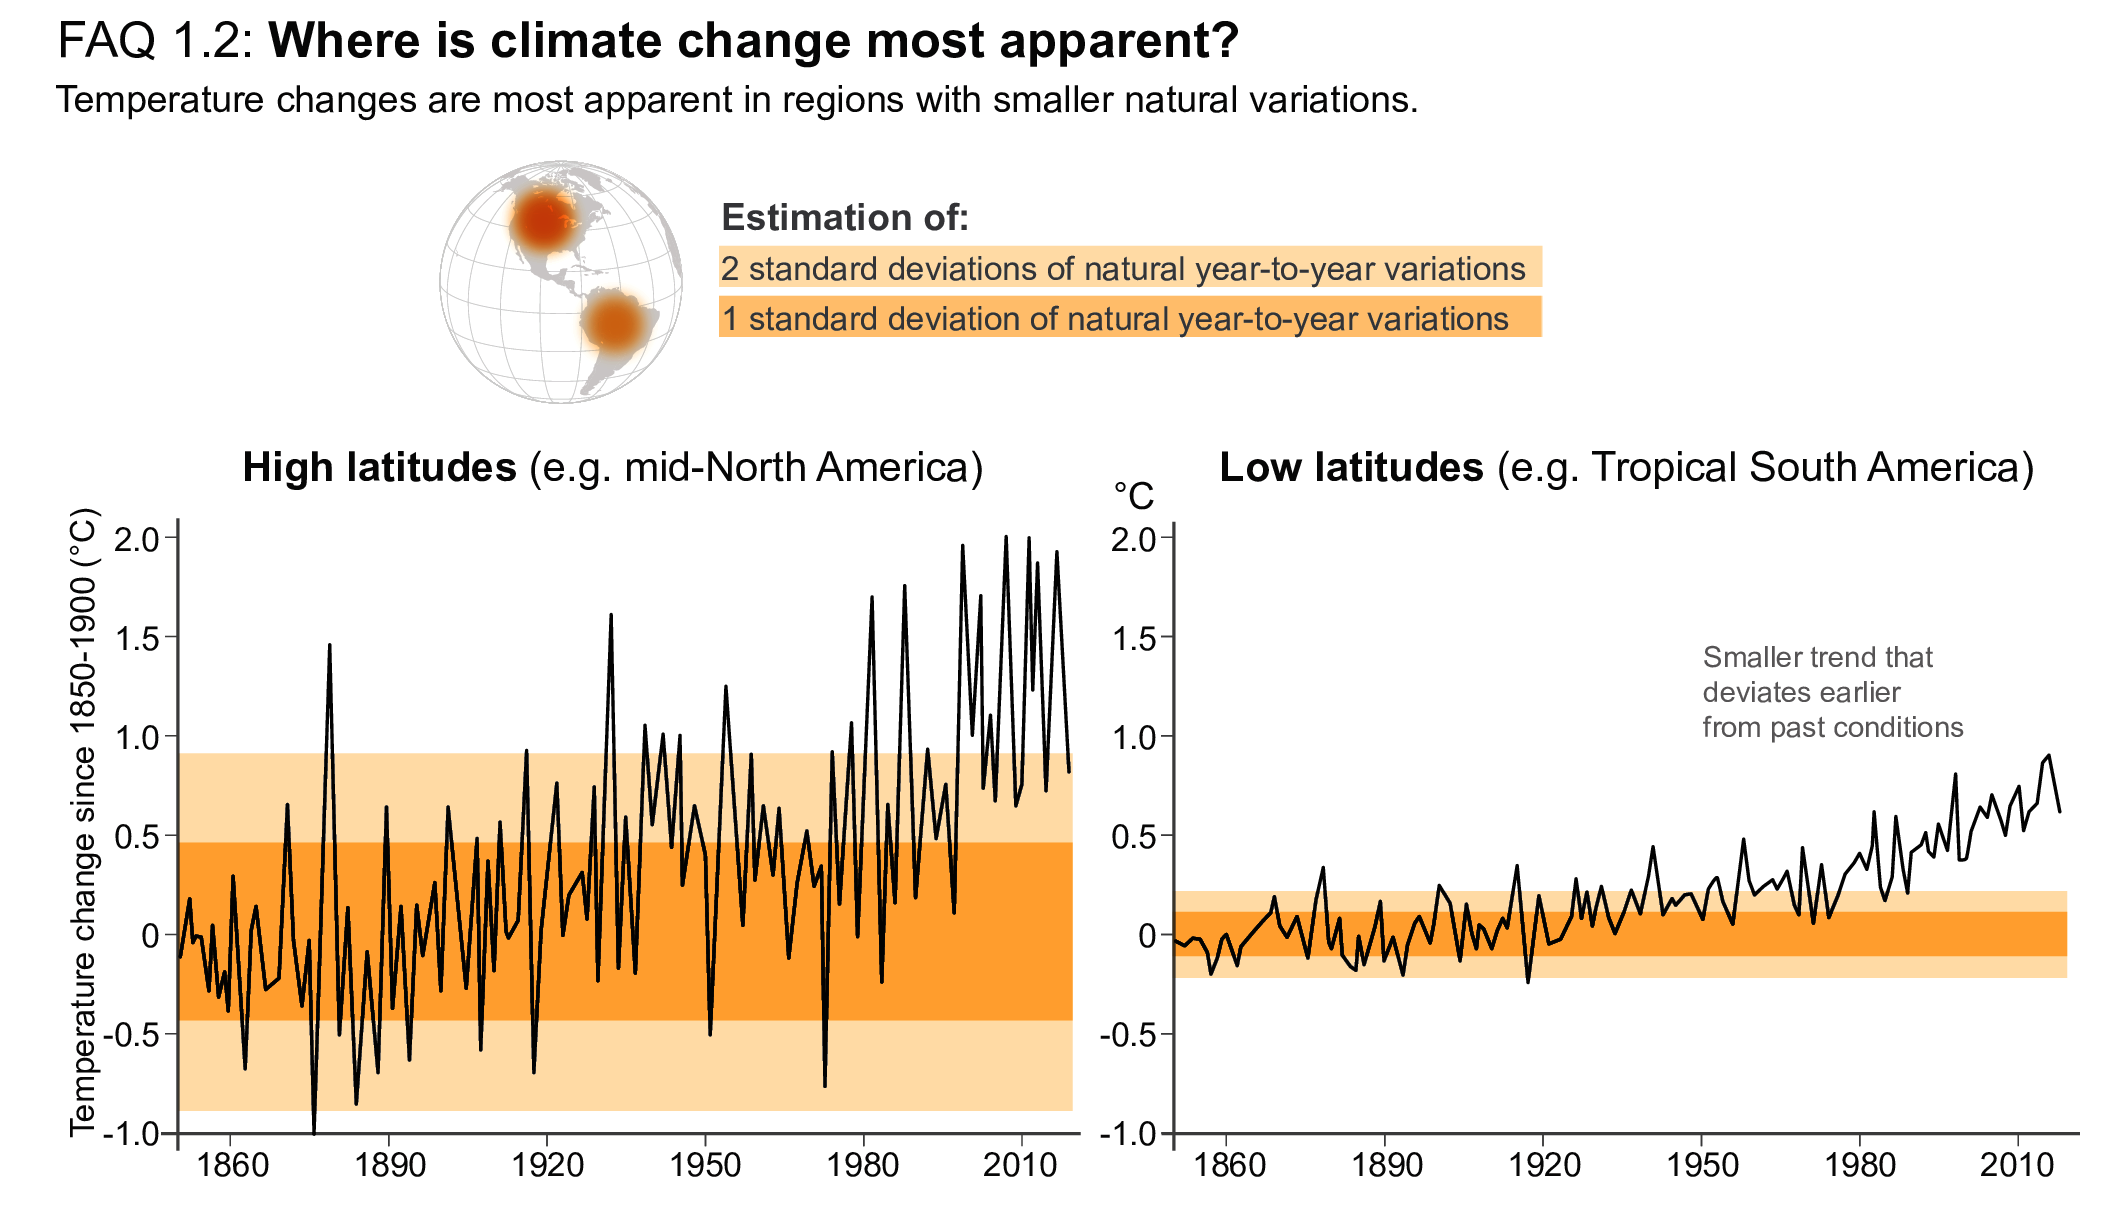
Figure caption
FAQ 1.2, Figure 1| Observed variations in regional temperatures since 1850(data from Berkeley Earth). Regions in high latitudes, such as mid-North America (40°N–64°N, 140°W–60°W, left), have warmed by a larger amount than regions at lower latitudes, such as tropical South America (10°S–10°N, 84°W–16°W, right), but the natural variations are also much larger at high latitudes (darker and lighter shading represents 1 and 2 standard deviations, respectively, of natural year-to-year variations). The signal of observed temperature change emerged earlier in tropical South America than mid-North America even though the changes were of a smaller magnitude. (Note that those regions were chosen because of the longer length of their observational record; see Figure 1.14 for more regions).