Back chapter figures
Figure 1.10
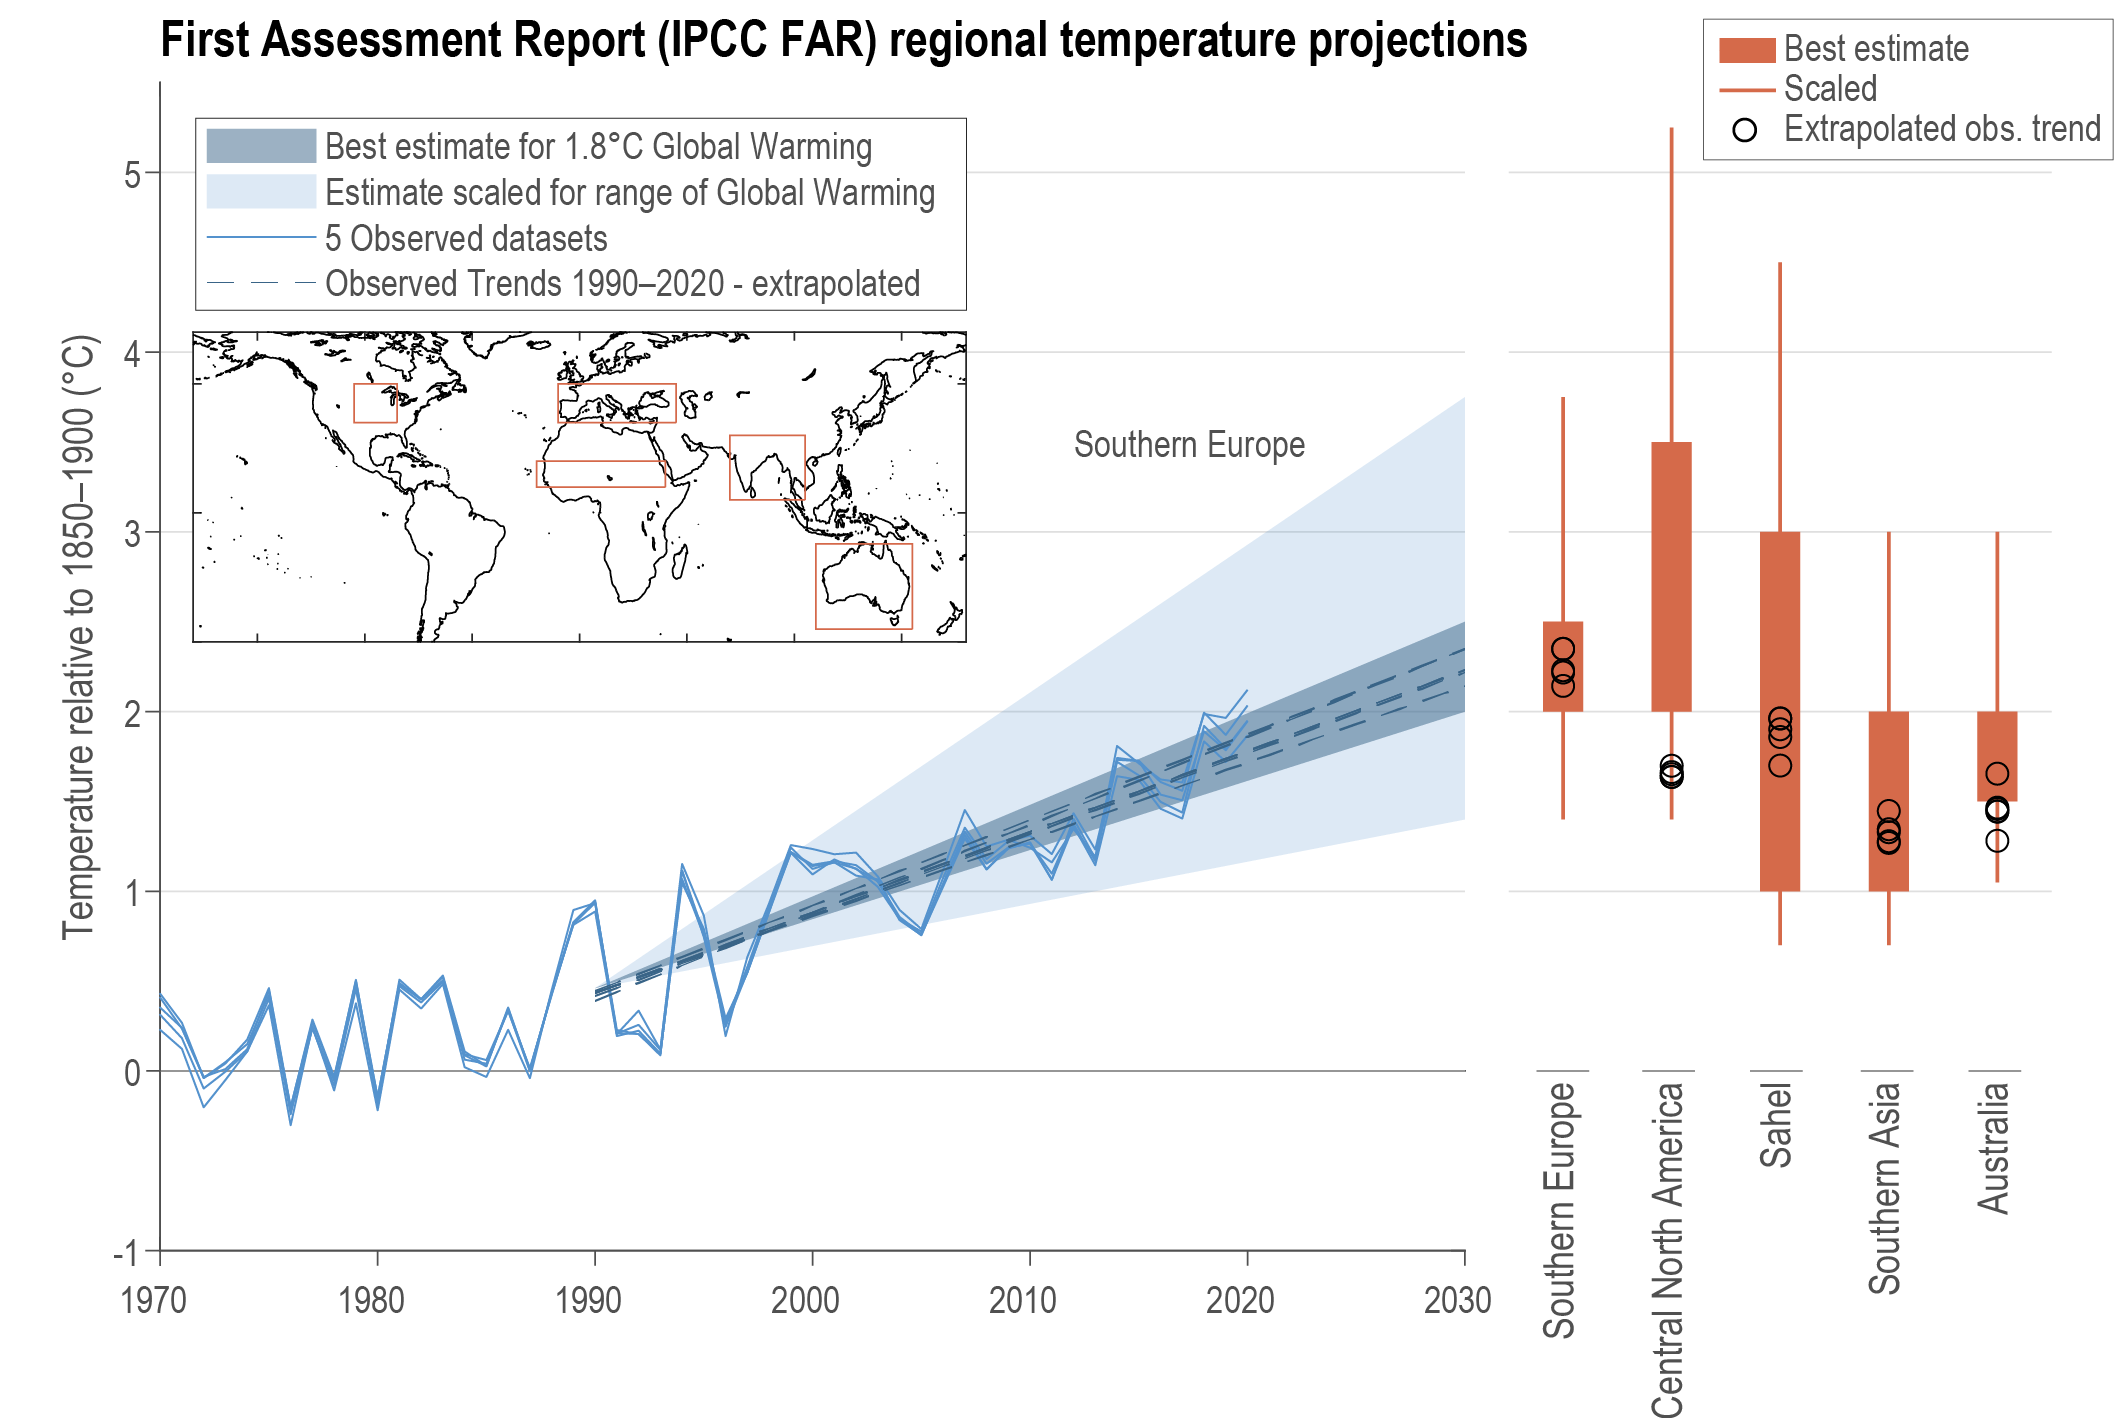
Figure caption
Figure 1.10 | Range of projected temperature change for 1990–2030 for various regions defined in IPCC First Assessment Report (FAR). The left-handpanel shows the FAR projections (IPCC, 1990a) for southern Europe, with the darker blue shade representing the range of projected change given for the best estimate of 1.8°C global warming by 2030 compared with pre-industrial levels, and the fainter blue shade showing the range scaled by–30% to +50% for lower and higher estimates of global warming. Blue lines show the regionally averaged observations from five global temperature gridded datasets, and blue dashed lines show the linear trends in those datasets for 1990–2020 extrapolated to 2030. Observed datasets are: HadCRUT5, Cowtan and Way, GISTEMP, Berkeley Earth and NOAA GlobalTemp. The inset map shows the definition of the FAR regions used. The right-handpanel shows projected temperature changes by 2030 for the various FAR regions, compared to the extrapolated observational trends, following Grose et al. (2017). Further details on data sources and processing are available in the chapter data table (Table 1.SM.1).