Back chapter figures
Figure 1.11
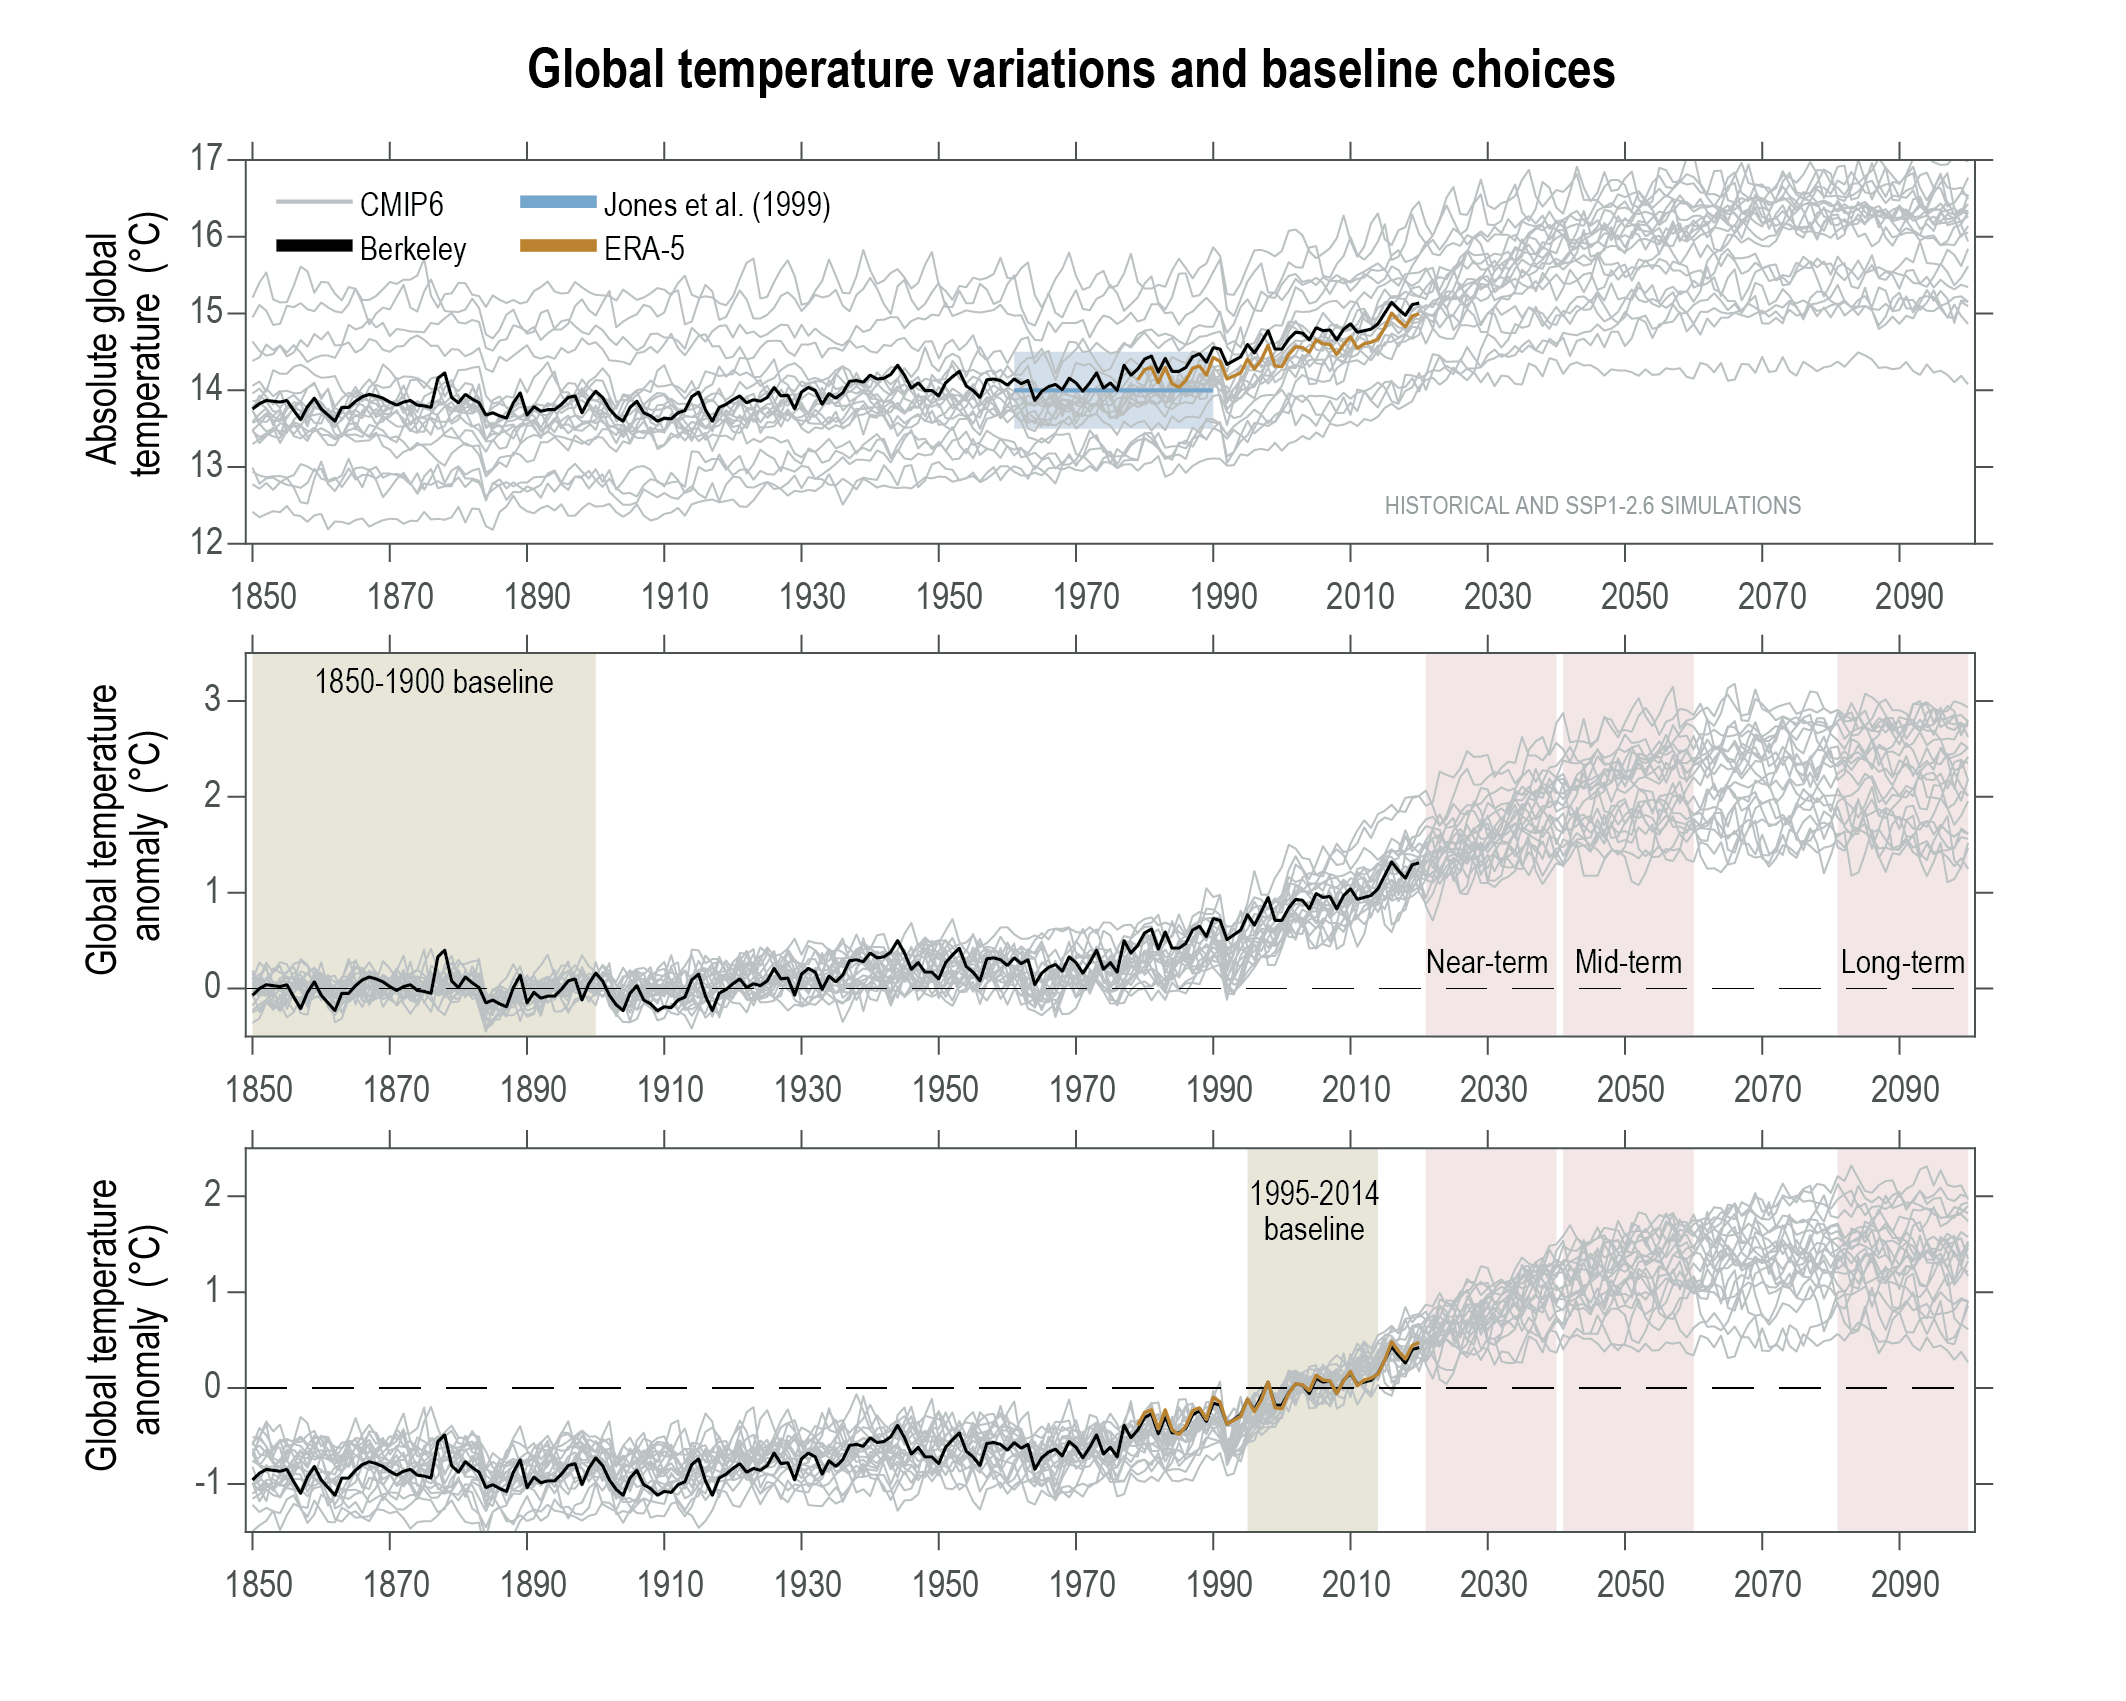
Figure caption
Figure 1.11 | Choice of baseline matters when comparing observations and model simulations. Global mean surface air temperature (GSAT, grey) from a range of CMIP6 historical simulations (1850–2014; 25 models) and SSP1-2.6 (2015–2100) using absolute values (top) and anomalies relative to two different baselines: 1850–1900 (middle) and 1995–2014 (bottom). An estimate of GSAT from a reanalysis (ERA-5, orange, 1979–2020) and an observation-based estimate of global mean surface air temperature (GMST) (Berkeley Earth, black, 1850–2020) are shown, along with the mean GSAT for 1961–1990 estimated by Jones et al. (1999), light blue shading (14.0°C ± 0.5°C). Using the more recent baseline (bottom) allows the inclusion of datasets which do not include the periods of older baselines. The middle and bottom panels have scales which are the same size but offset. Further details on data sources and processing are available in the chapter data table (Table 1.SM.1).