Back chapter figures
Figure 1.12
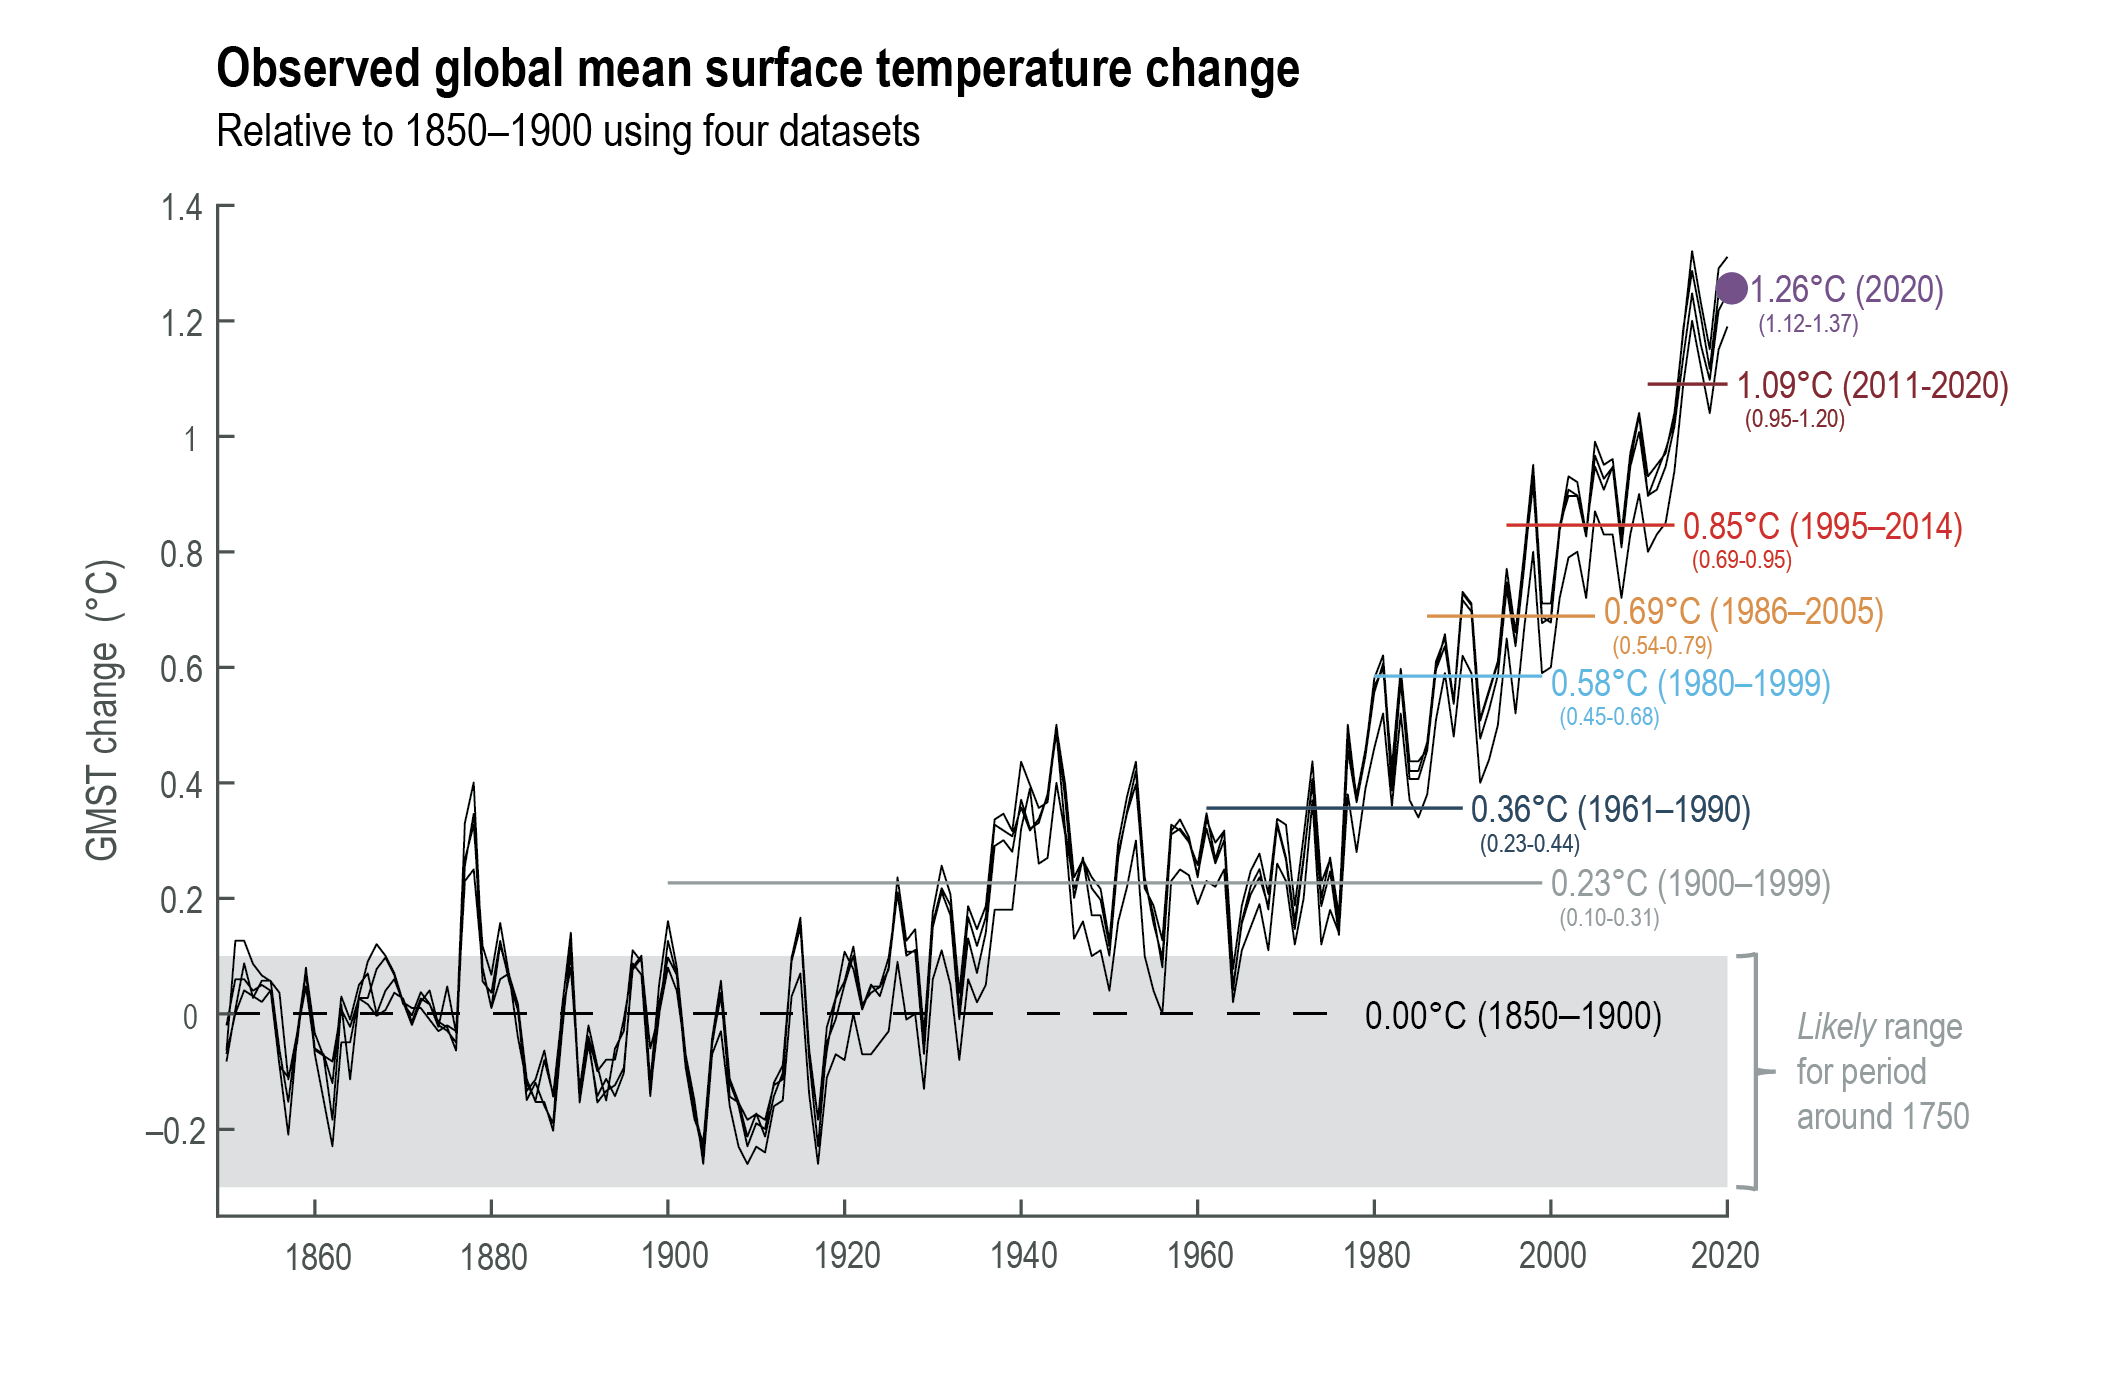
Figure caption
Figure 1.12 | Global warming over the instrumental period. Observed global mean surface temperature (GMST) from four datasets, relative to the average temperature of 1850–1900 in each dataset (see Cross-Chapter Box 2.3 and Section 2.3.1.1 for more details). The shaded grey band indicates the assessed likely range for the period around 1750 (Cross-Chapter Box 1.2). Different reference periods are indicated by the coloured horizontal lines, and an estimate of total GMST change up to that period is given, enabling a translation of the level of warming between different reference periods. The reference periods are all chosen because they have been used in AR6 or previous IPCC assessment reports. The value for the 1981–2010 reference period, used as a ‘climate normal’ period by the World Meteorological Organization, is the same as the 1986–2005 reference period shown. Further details on data sources and processing are available in the chapter data table (Table 1.SM.1).