Back chapter figures
Figure 1.13
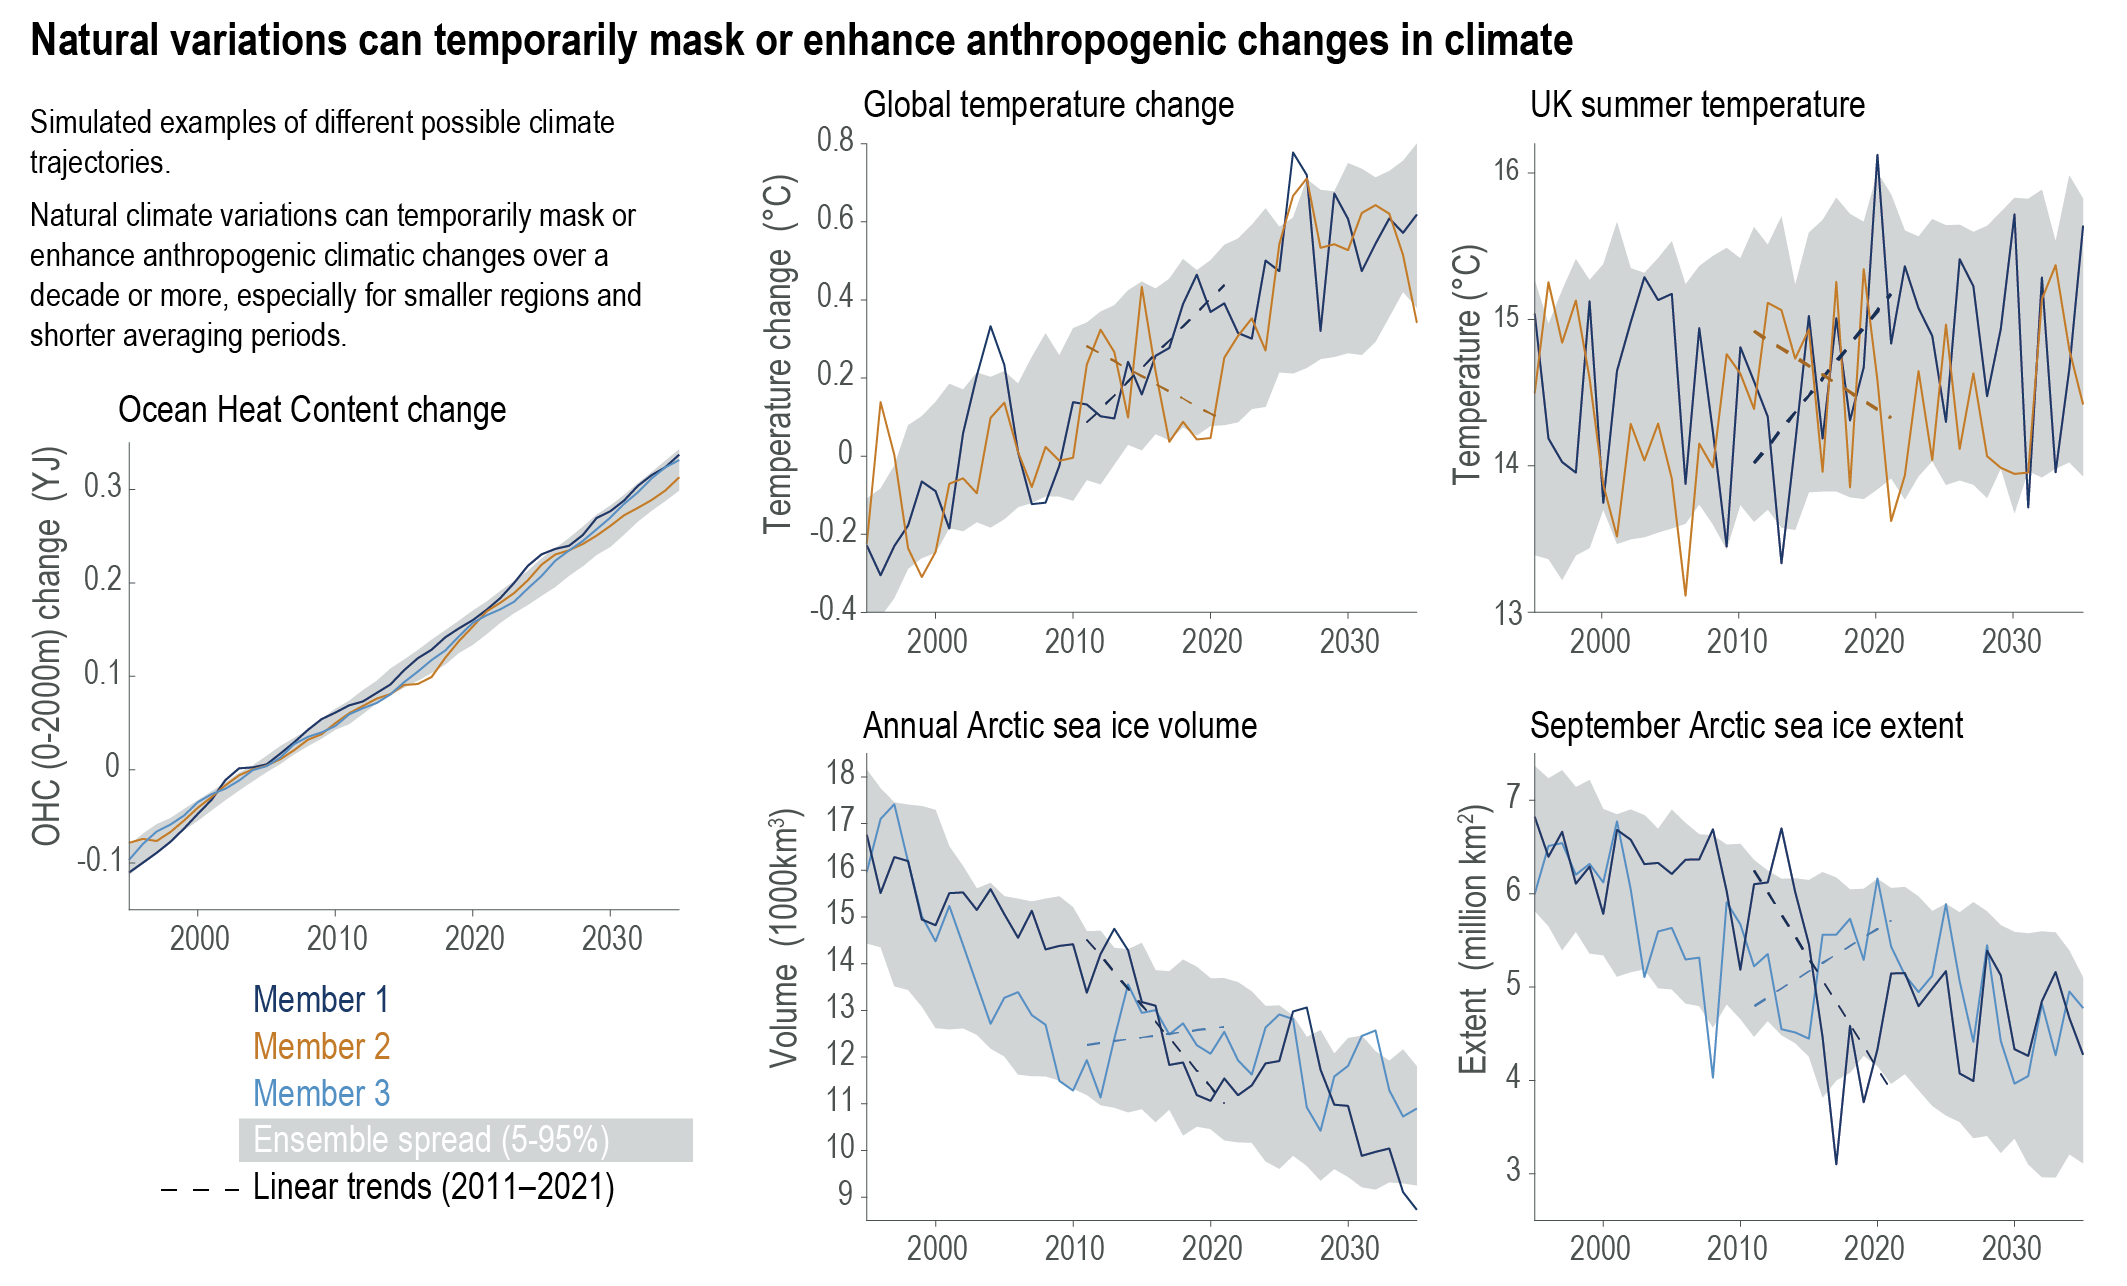
Figure caption
Figure 1.13 | Simulated changes in various climate indicators under historical and RCP4.5 scenarios using the MPI ESM Grand Ensemble. The grey shading shows the 5–95% range from the 100-member ensemble. The coloured lines represent individual example ensemble members, with linear trends for the 2011–2021 period indicated by the dashed lines. Changes in ocean heat content (OHC) over the top 2000 m represents the integrated signal of global warming (left). The top rowshows surface air temperature-related indicators (annual GSAT change and UK summer temperatures) and The bottom rowshows Arctic sea ice-related indicators (annual ice volume and September sea ice extent). For smaller regions and for shorter time-period averages the variability increases and simulated short-term trends can temporarily mask or enhance anthropogenic changes in climate. Data from Maher et al. (2019). Further details on data sources and processing are available in the chapter data table (Table 1.SM.1).