Back chapter figures
Figure 1.16
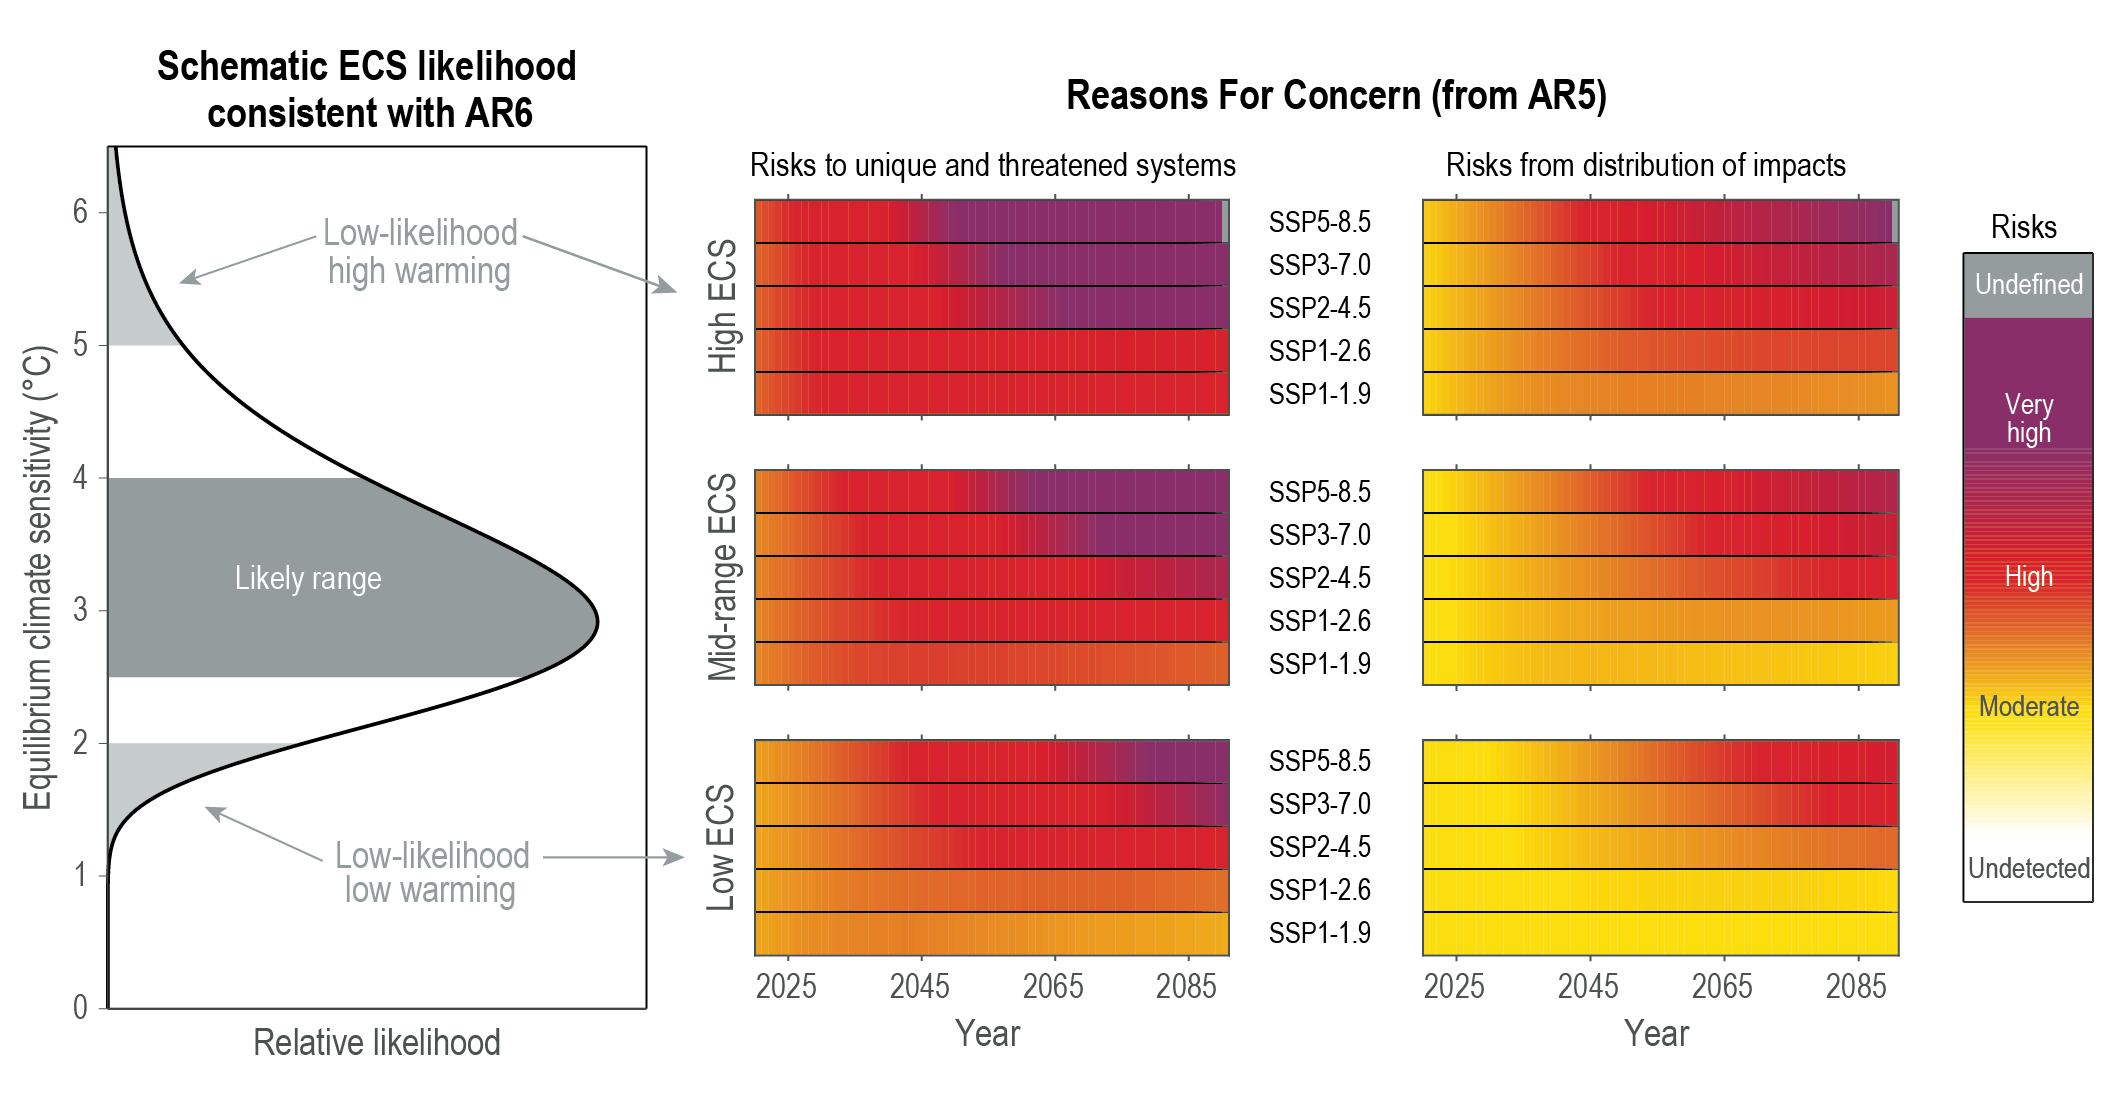
Figure caption
Figure 1.16 | Illustrating concepts of low-likelihood outcomes. Left: schematic likelihood distribution consistent with the IPCC AR6 assessments that equilibrium climate sensitivity (ECS) is likely in the range 2.5°C to 4.0°C, and very likely between 2.0°C and 5.0°C (Chapter 7). ECS values outside the assessed very likely range are designated low-likelihood outcomes in this example (light grey). Middle and right-hand columns: additional risks due to climate change for 2020–2090 using the Reasons For Concern (RFCs, see IPCC, 2014b), specifically RFC1 describing the risks to unique and threatened systems and RFC3 describing risks from the distribution of impacts (O’Neill et al., 2017b; Zommers et al., 2020). The projected changes of GSAT used are the 95%, median and 5% assessed ranges from Chapter 4 for each SSP (top, middle and bottom); these are designated High ECS, Mid-range ECS and Low ECS respectively. The ‘burning-ember’ risk spectrum of graduated colours is usually associated with levels of committed GSAT change; instead, this illustration associates the risk spectrum with the GSAT temperature reached in each year from 2020 to 2090. Note that this illustration does not include the vulnerability aspect of each SSP scenario. Further details on data sources and processing are available in the chapter data table (Table 1.SM.1).