Back chapter figures
Figure 1.27
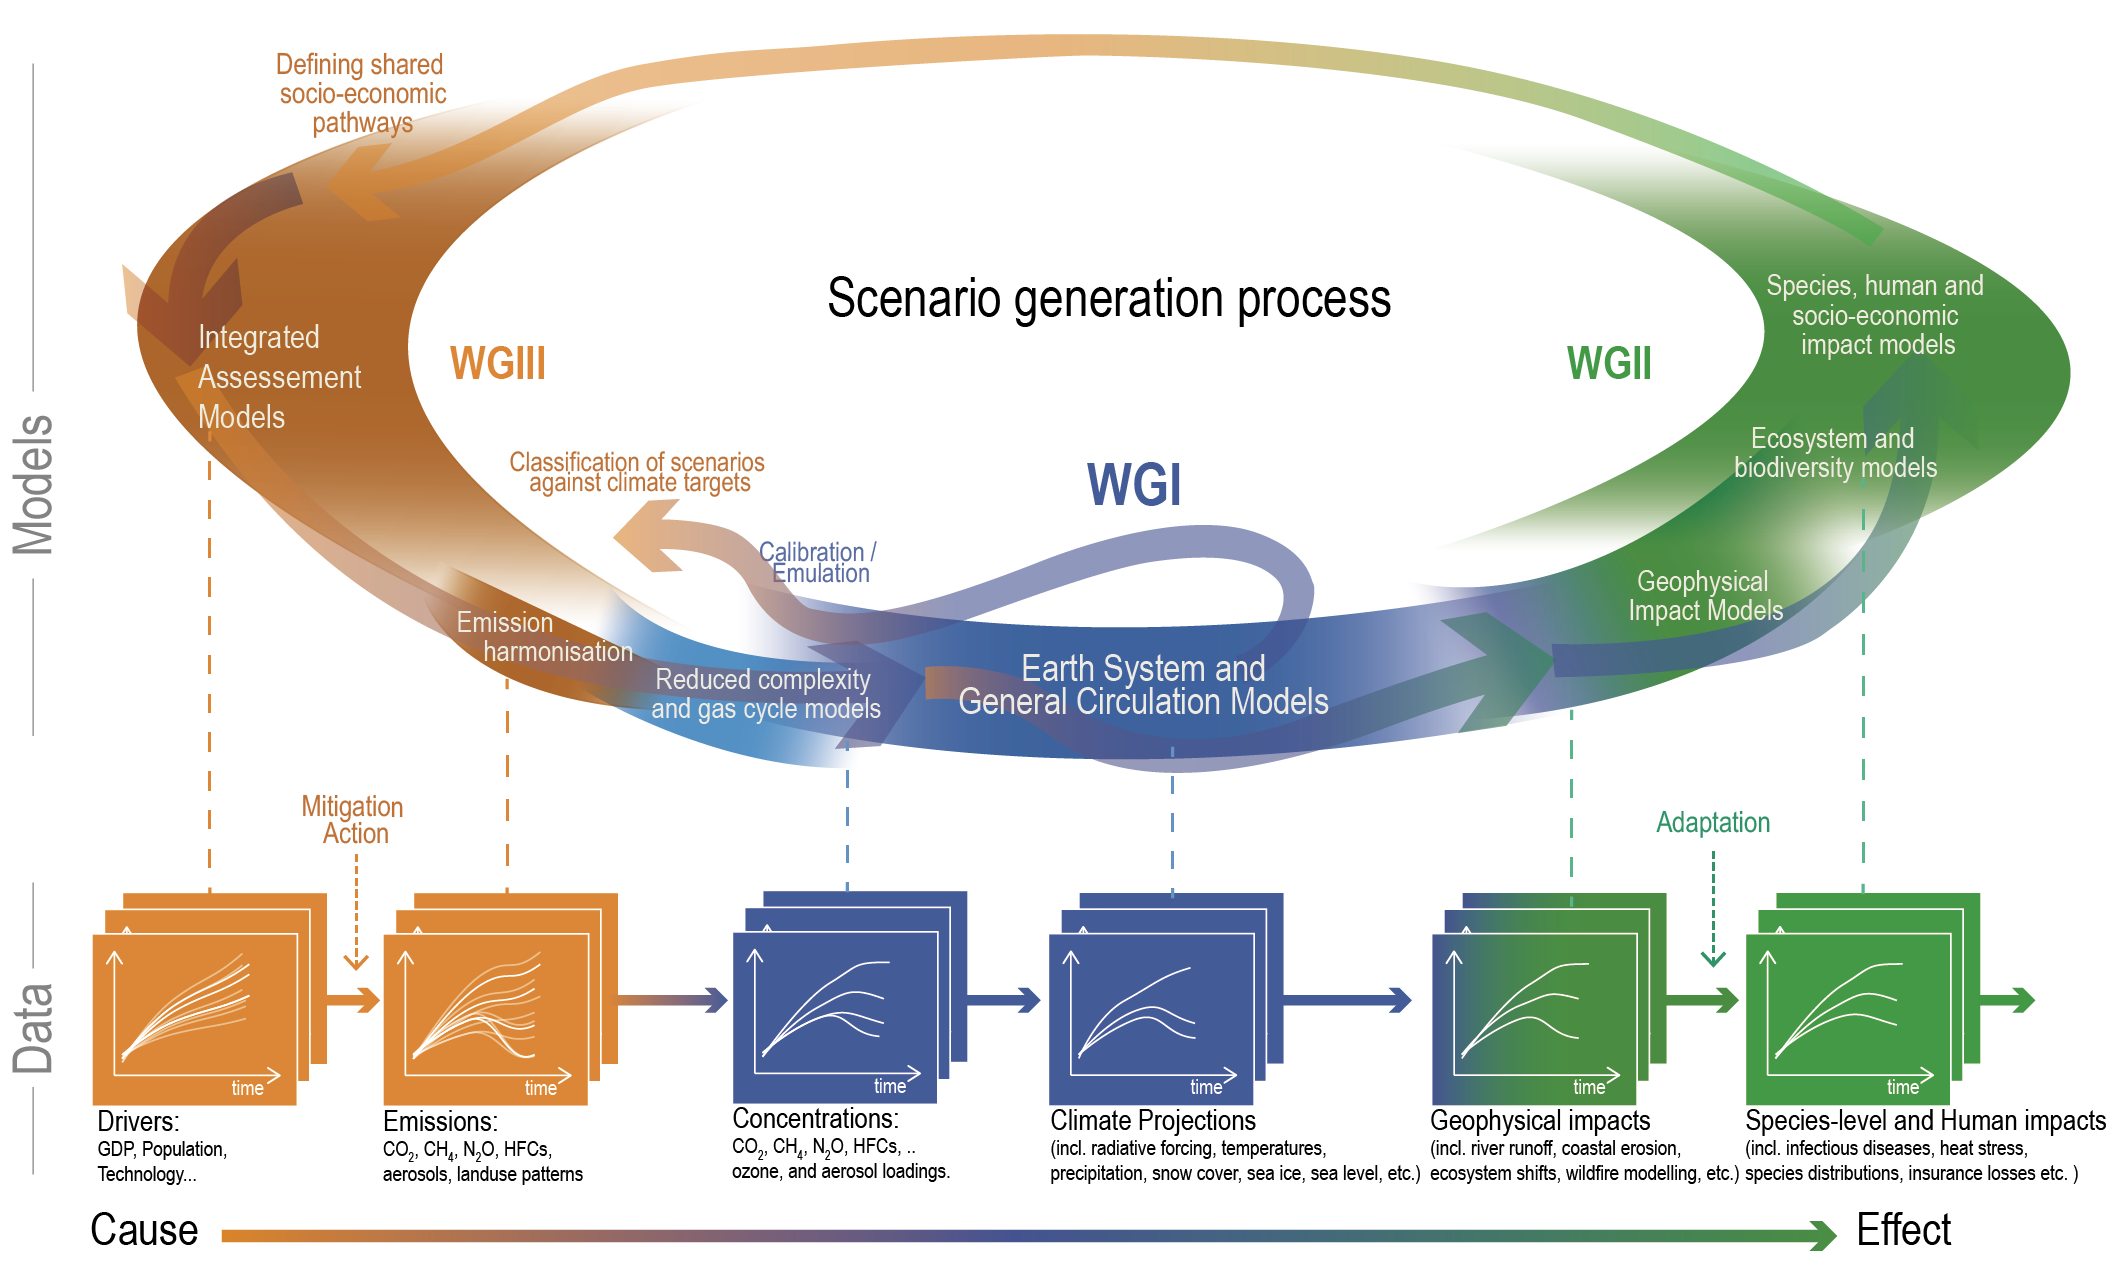
Figure caption
Figure 1.27 | A simplified illustration of the scenario generation process, involving the scientific communities represented in the three IPCC Working Groups. The circular set of arrows at the top indicates the main set of models and workflows used in the scenario generation process, with the lower level indicating the datasets.