Back chapter figures
Figure 1.4
Figure caption
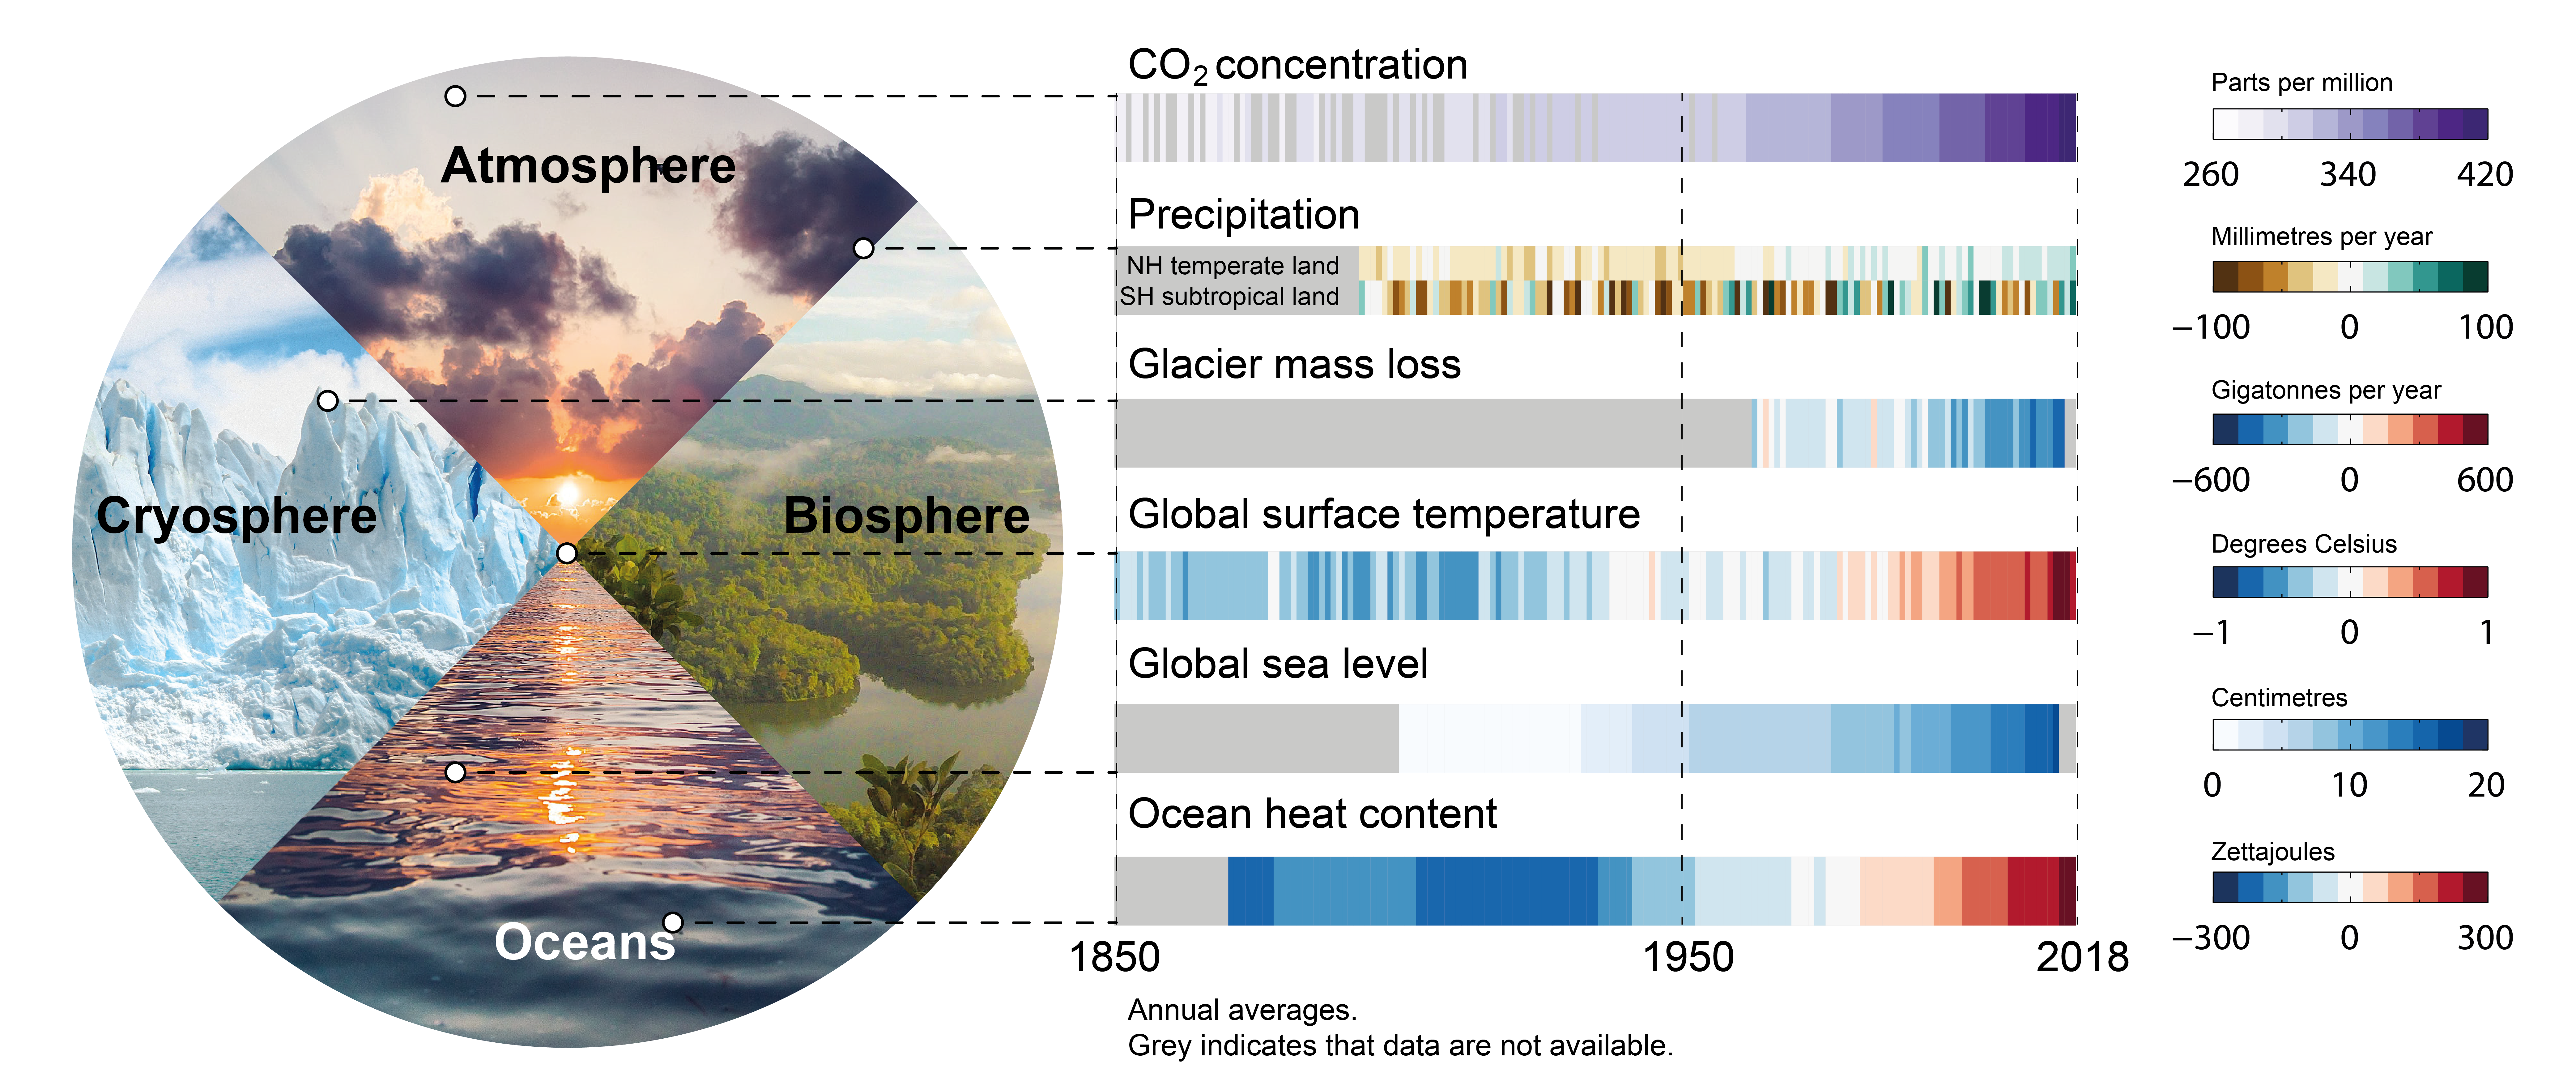
Figure 1.4 | Changes are occurring throughout the climate system. Left: Main realms of the climate system: atmosphere, biosphere, cryosphere and ocean. Right: Six key indicators of ongoing changes since 1850, or the start of the observational or assessed record, through 2018. Each stripe indicates the global (except for precipitation which shows two latitude band means), annual mean anomaly for a single year, relative to a multi-year baseline (except for CO2 concentration and glacier mass loss, which are absolute values). Grey indicates that data are not available. Datasets and baselines used are: (i) CO2: Antarctic ice cores (Lüthi et al., 2008; Bereiter et al., 2015) and direct air measurements (Tans and Keeling, 2020) (see Figure 1.5 for details); (ii) precipitation: Global Precipitation Climatology Centre (GPCC) V8 (updated from Beckeret al., 2013), baseline 1961–1990 using land areas only with latitude bands 33°N–66°N and 15°S–30°S; (iii) glacier mass loss: Zemp et al. (2019); (iv) global surface air temperature (GMST): HadCRUT5 (Morice et al., 2021), baseline 1961–1990; (v) sea level change: (Dangendorf et al., 2019), baseline 1900–1929; (vi) ocean heat content (model–observation hybrid): Zanna et al. (2019), baseline 1961–1990. Further details on data sources and processing are available in the chapter data table (Table 1.SM.1).
