Back chapter figures
Figure 1.5
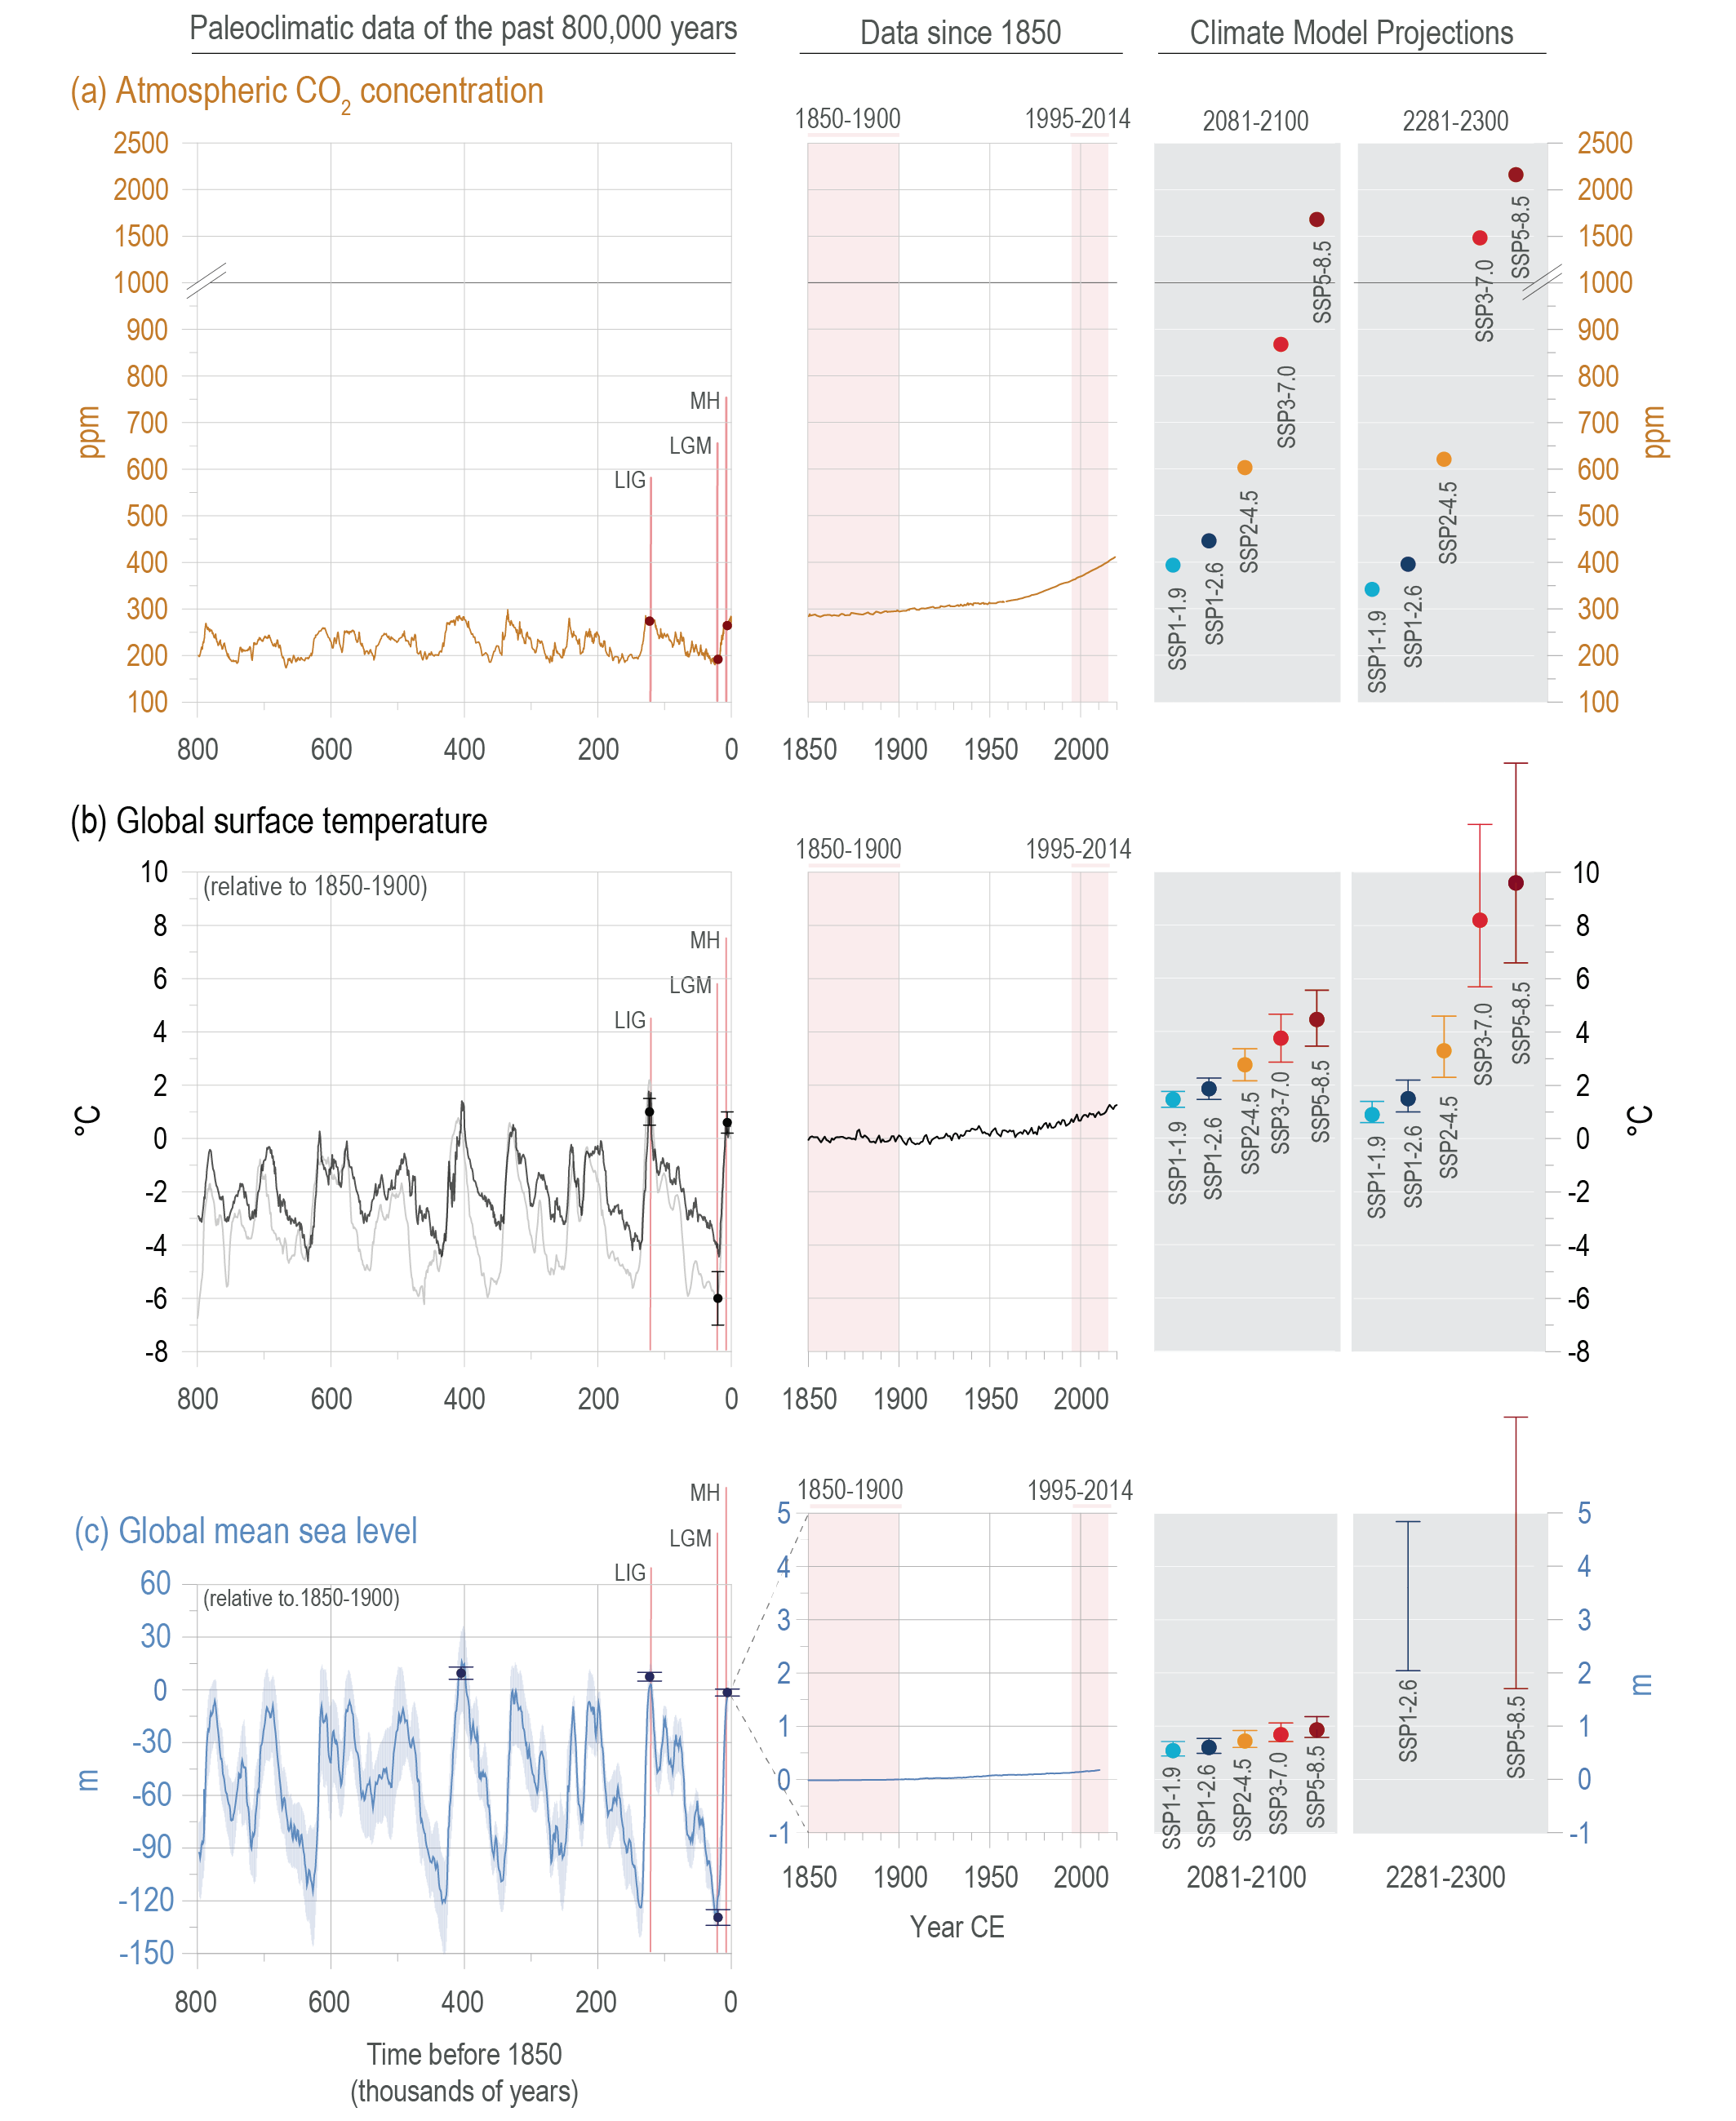
Figure caption
Figure 1.5 | Long-term context of anthropogenic climate changebased on selected paleoclimatic reconstructions over the past 800,000 years (800 kyr) for three key indicators: atmospheric CO2 concentrations, global mean surface temperature (GMST), and global mean sea level (GMSL). (a) Measurements of CO2in air enclosed in Antarctic ice cores (Lüthiet al. , 2008; Bereiteret al. , 2015 [a compilation]; uncertainty ±1.3 ppm; see Sections 2.2.3 and 5.1.2 for an assessment) and direct air measurements (Tans and Keeling, 2020; uncertainty ±0.12 ppm). Projected CO2 concentrations for five Shared Socio-economic Pathways (SSP) scenarios are indicated by dots on the right-hand side of each panel (grey background; (Meinshausenet al. , 2020; SSPs are described in Section 1.6). (b) Reconstruction of GMST from marine paleoclimate proxies (light-grey line: Snyder (2016); dark grey line: Hansenet al. (2013); see Section 2.3.1 for an assessment). Observed and reconstructed temperature changes since 1850 are the AR6 assessed mean (referenced to 1850–1900; Box TS.3; 2.3.1.1); dots/whiskers on the right-hand panels (grey background) indicate the projected mean and ranges of warming derived from Coupled Model Intercomparison Project Phase 6 (CMIP6) SSP-based (2081–2100) and Model for the Assessment of Greenhouse Gas Induced Climate Change (MAGICC7; 2300) simulations (Tables 4.5 and 4.9). (c) Sea level changes reconstructed from a stack of oxygen isotope measurements on seven ocean sediment cores (Spratt and Lisiecki, 2016; see Chapter 2, Section 2.3.3.3 and Chapter 9, Section 9.6.2 for an assessment). The sea level record from 1850–1900 is from Koppet al. (2016), while the 20th century record is an updated ensemble estimate of GMSL change (Palmeret al. , 2021; Sections 2.3.3.3 and 9.6.1.1). Dots/whiskers on the right-hand panels of the figure (grey background) indicate the projected median and ranges derived from SSP-based simulations (2081–2100: Table 9.9; 2300: Section 9.6.3.5). Best estimates (dots) and uncertainties (whiskers), as assessed in Chapter 2, are included in the left and middle panels for each of the three indicators and selected paleo-reference periods used in this report (CO2: Table 2.1; GMST: Section 2.3.1.1 and Cross-Chapter Box 2.3, Table 1; GMSL: Sections 2.3.3.3 and 9.6.2. See also Cross-Chapter Box 2.1). Selected paleo-reference periods: LIG – Last Interglacial; LGM – Last Glacial Maximum; MH – mid-Holocene (Cross-Chapter Box 2.1, Table 1). The non-labelled best estimate in panel (c) corresponds to the sea level high-stand during Marine Isotope Stage 11, about 410 ka (410,000 years ago; Section 9.6.2). Further details on data sources and processing are available in the chapter data Table (Table 1.SM.1).