Back chapter figures
Figure 1.6
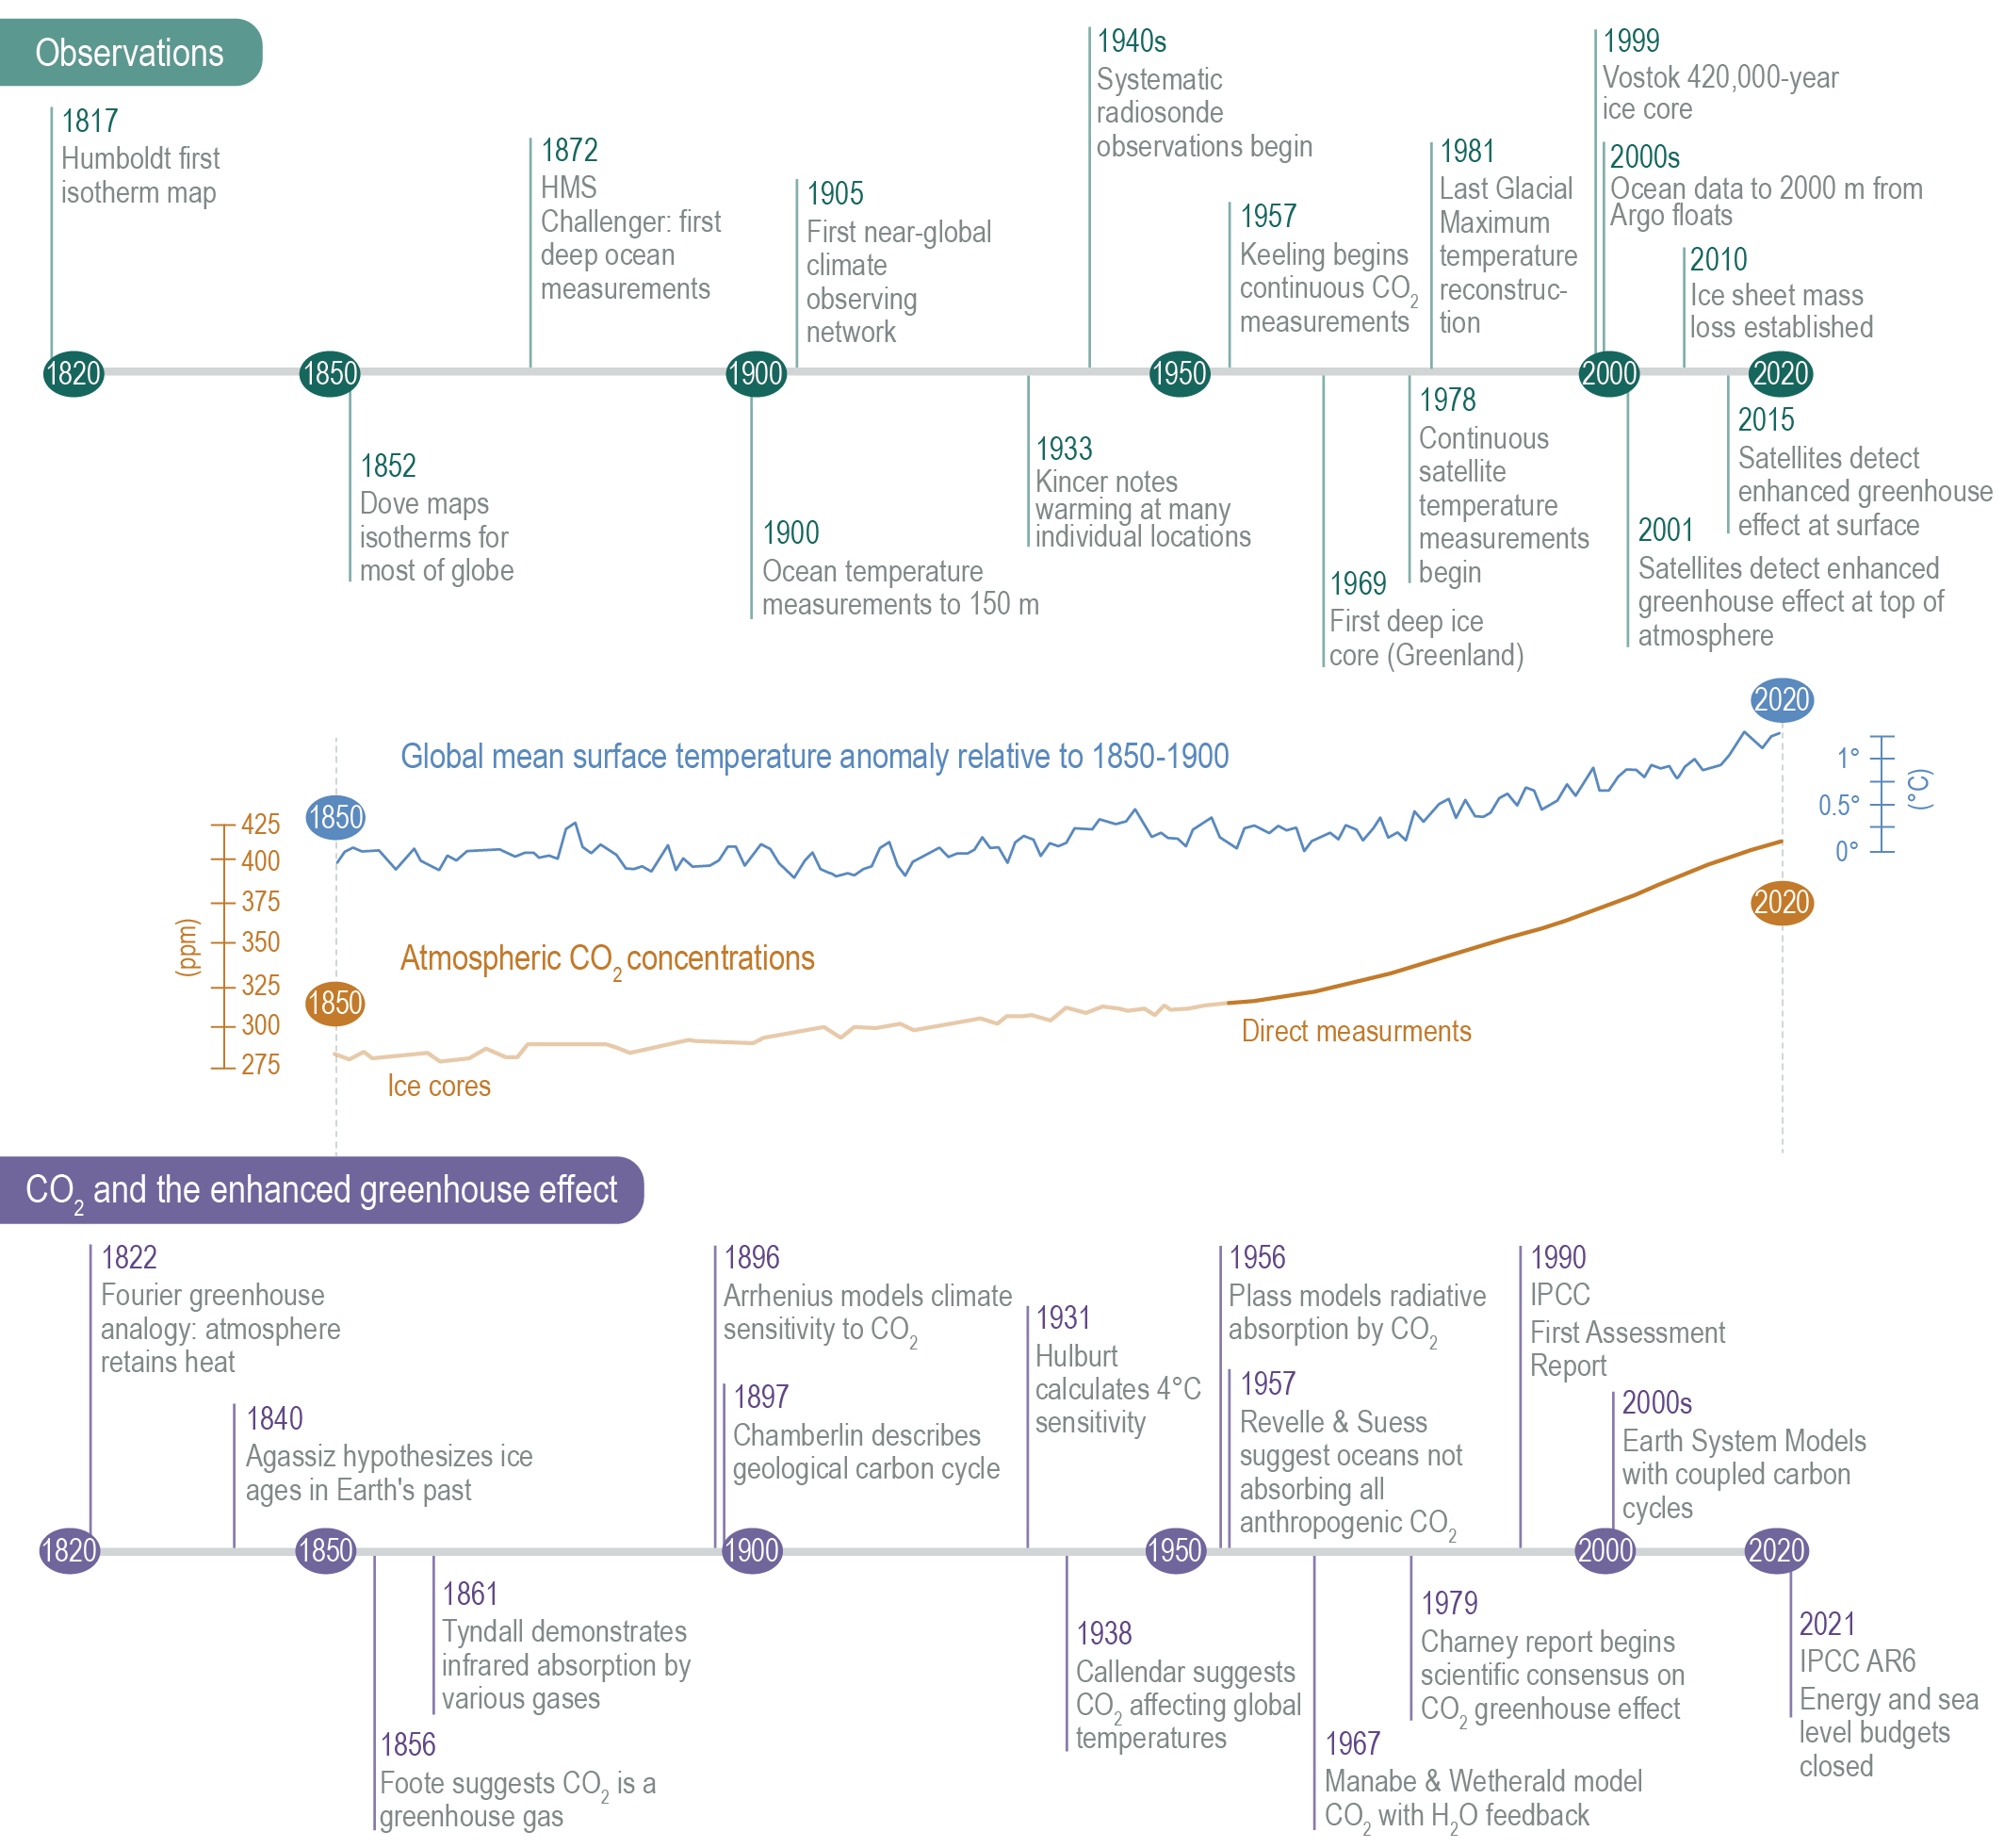
Figure caption
Figure 1.6 | Climate science milestones, between 1817 and 2021. Top: Milestones in observations. Middle: Curves of global surface air temperature (GMST) anomaly relative to 1850–1900, using HadCRUT5 (Morice et al., 2021); atmospheric CO2 concentrations from Antarctic ice cores (Lüthi et al., 2008; Bereiter et al., 2015); direct air measurements from 1957 onwards (see Figure 1.4 for details; Tans and Keeling, 2020). Bottom: Milestones in scientific understanding of the CO2 -enhanced greenhouse effect. Further details on each milestone are available in Section 1.3, and in Chapter 1 of AR4 (Le Treut et al., 2007).