Back chapter figures
Figure 1.8
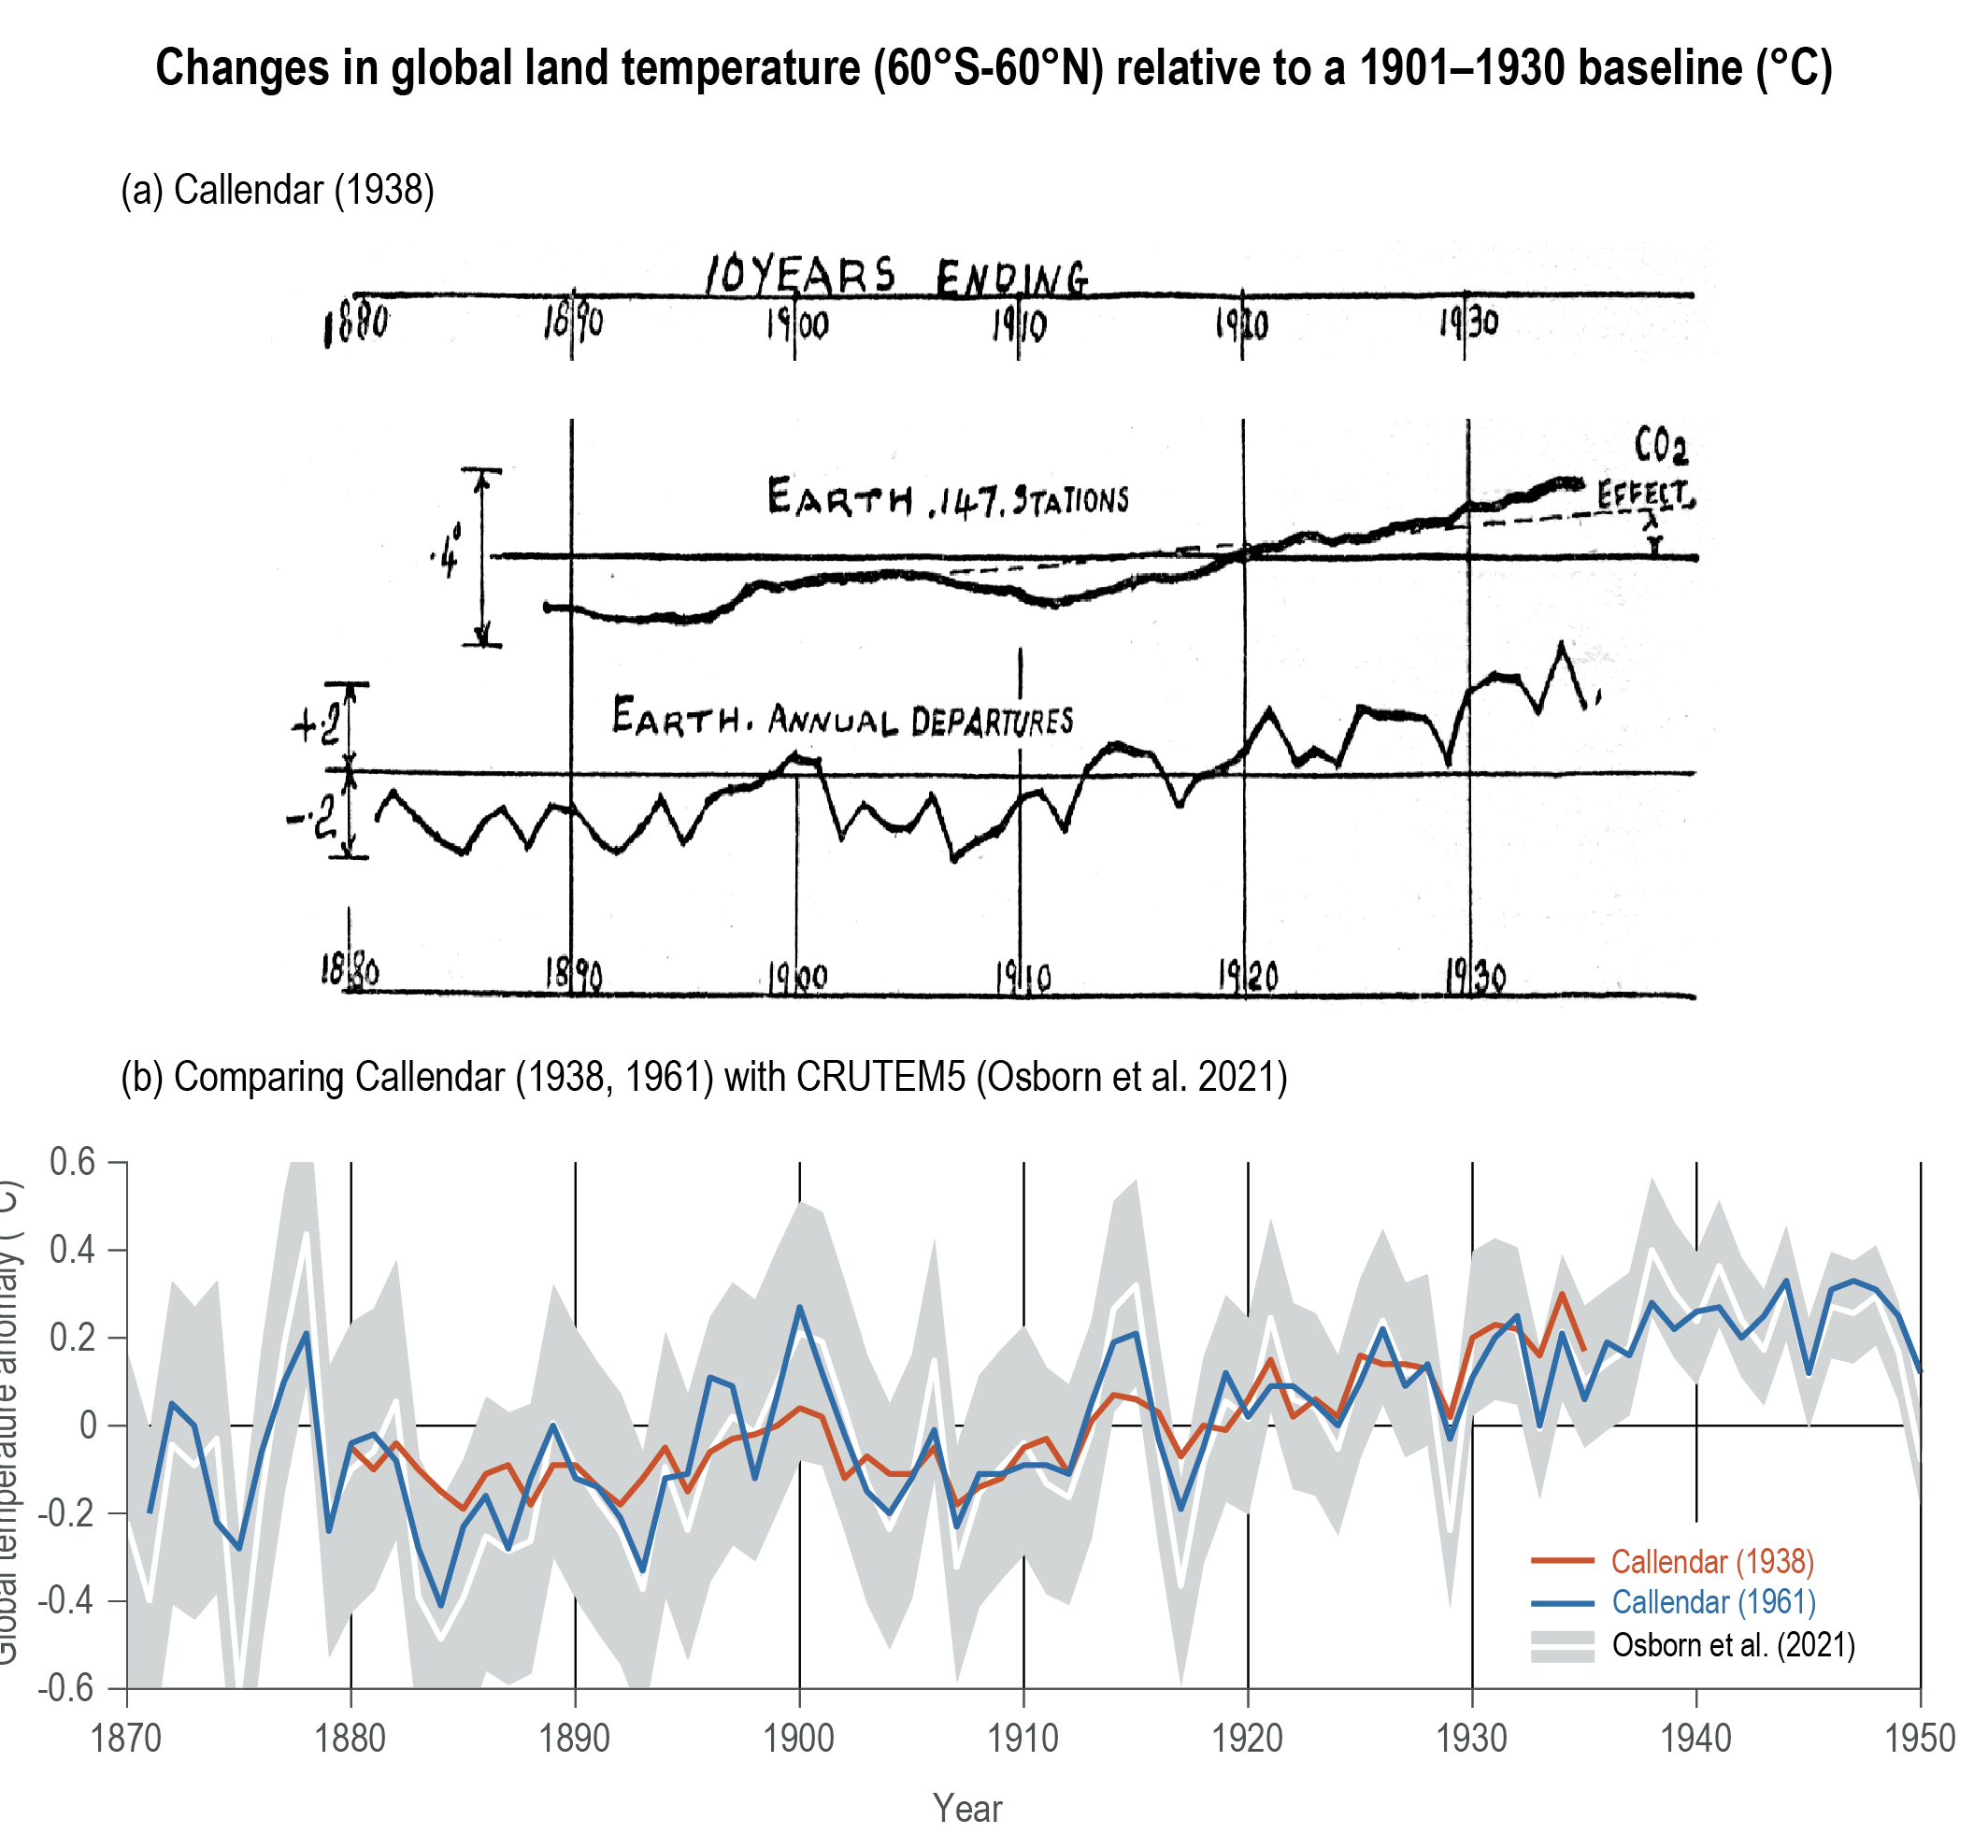
Figure caption
Figure 1.8 | G.S. Callendar’s estimates of global land temperature variations and their possible causes. (a) The original figure from Callendar (1938), using measurements from 147 surface stations for 1880–1935, showing: (top) ten-year moving departures from the mean of 1901–1930 (°C), with the dashed line representing his estimate of the ‘CO2 effect’ on temperature rise, and (bottom) annual departures from the 1901–1930 mean (°C). (b) Comparing the estimates of global land (60°S–60°N) temperatures tabulated in Callendar (1938, 1961) with a modern reconstruction (CRUTEM5, Osborn et al., 2021) for the same period, following Hawkins and Jones (2013). Further details on data sources and processing are available in the chapter data table (Table 1.SM.1).