Back chapter figures
Cross-Chapter Box 10.2, Figure 1
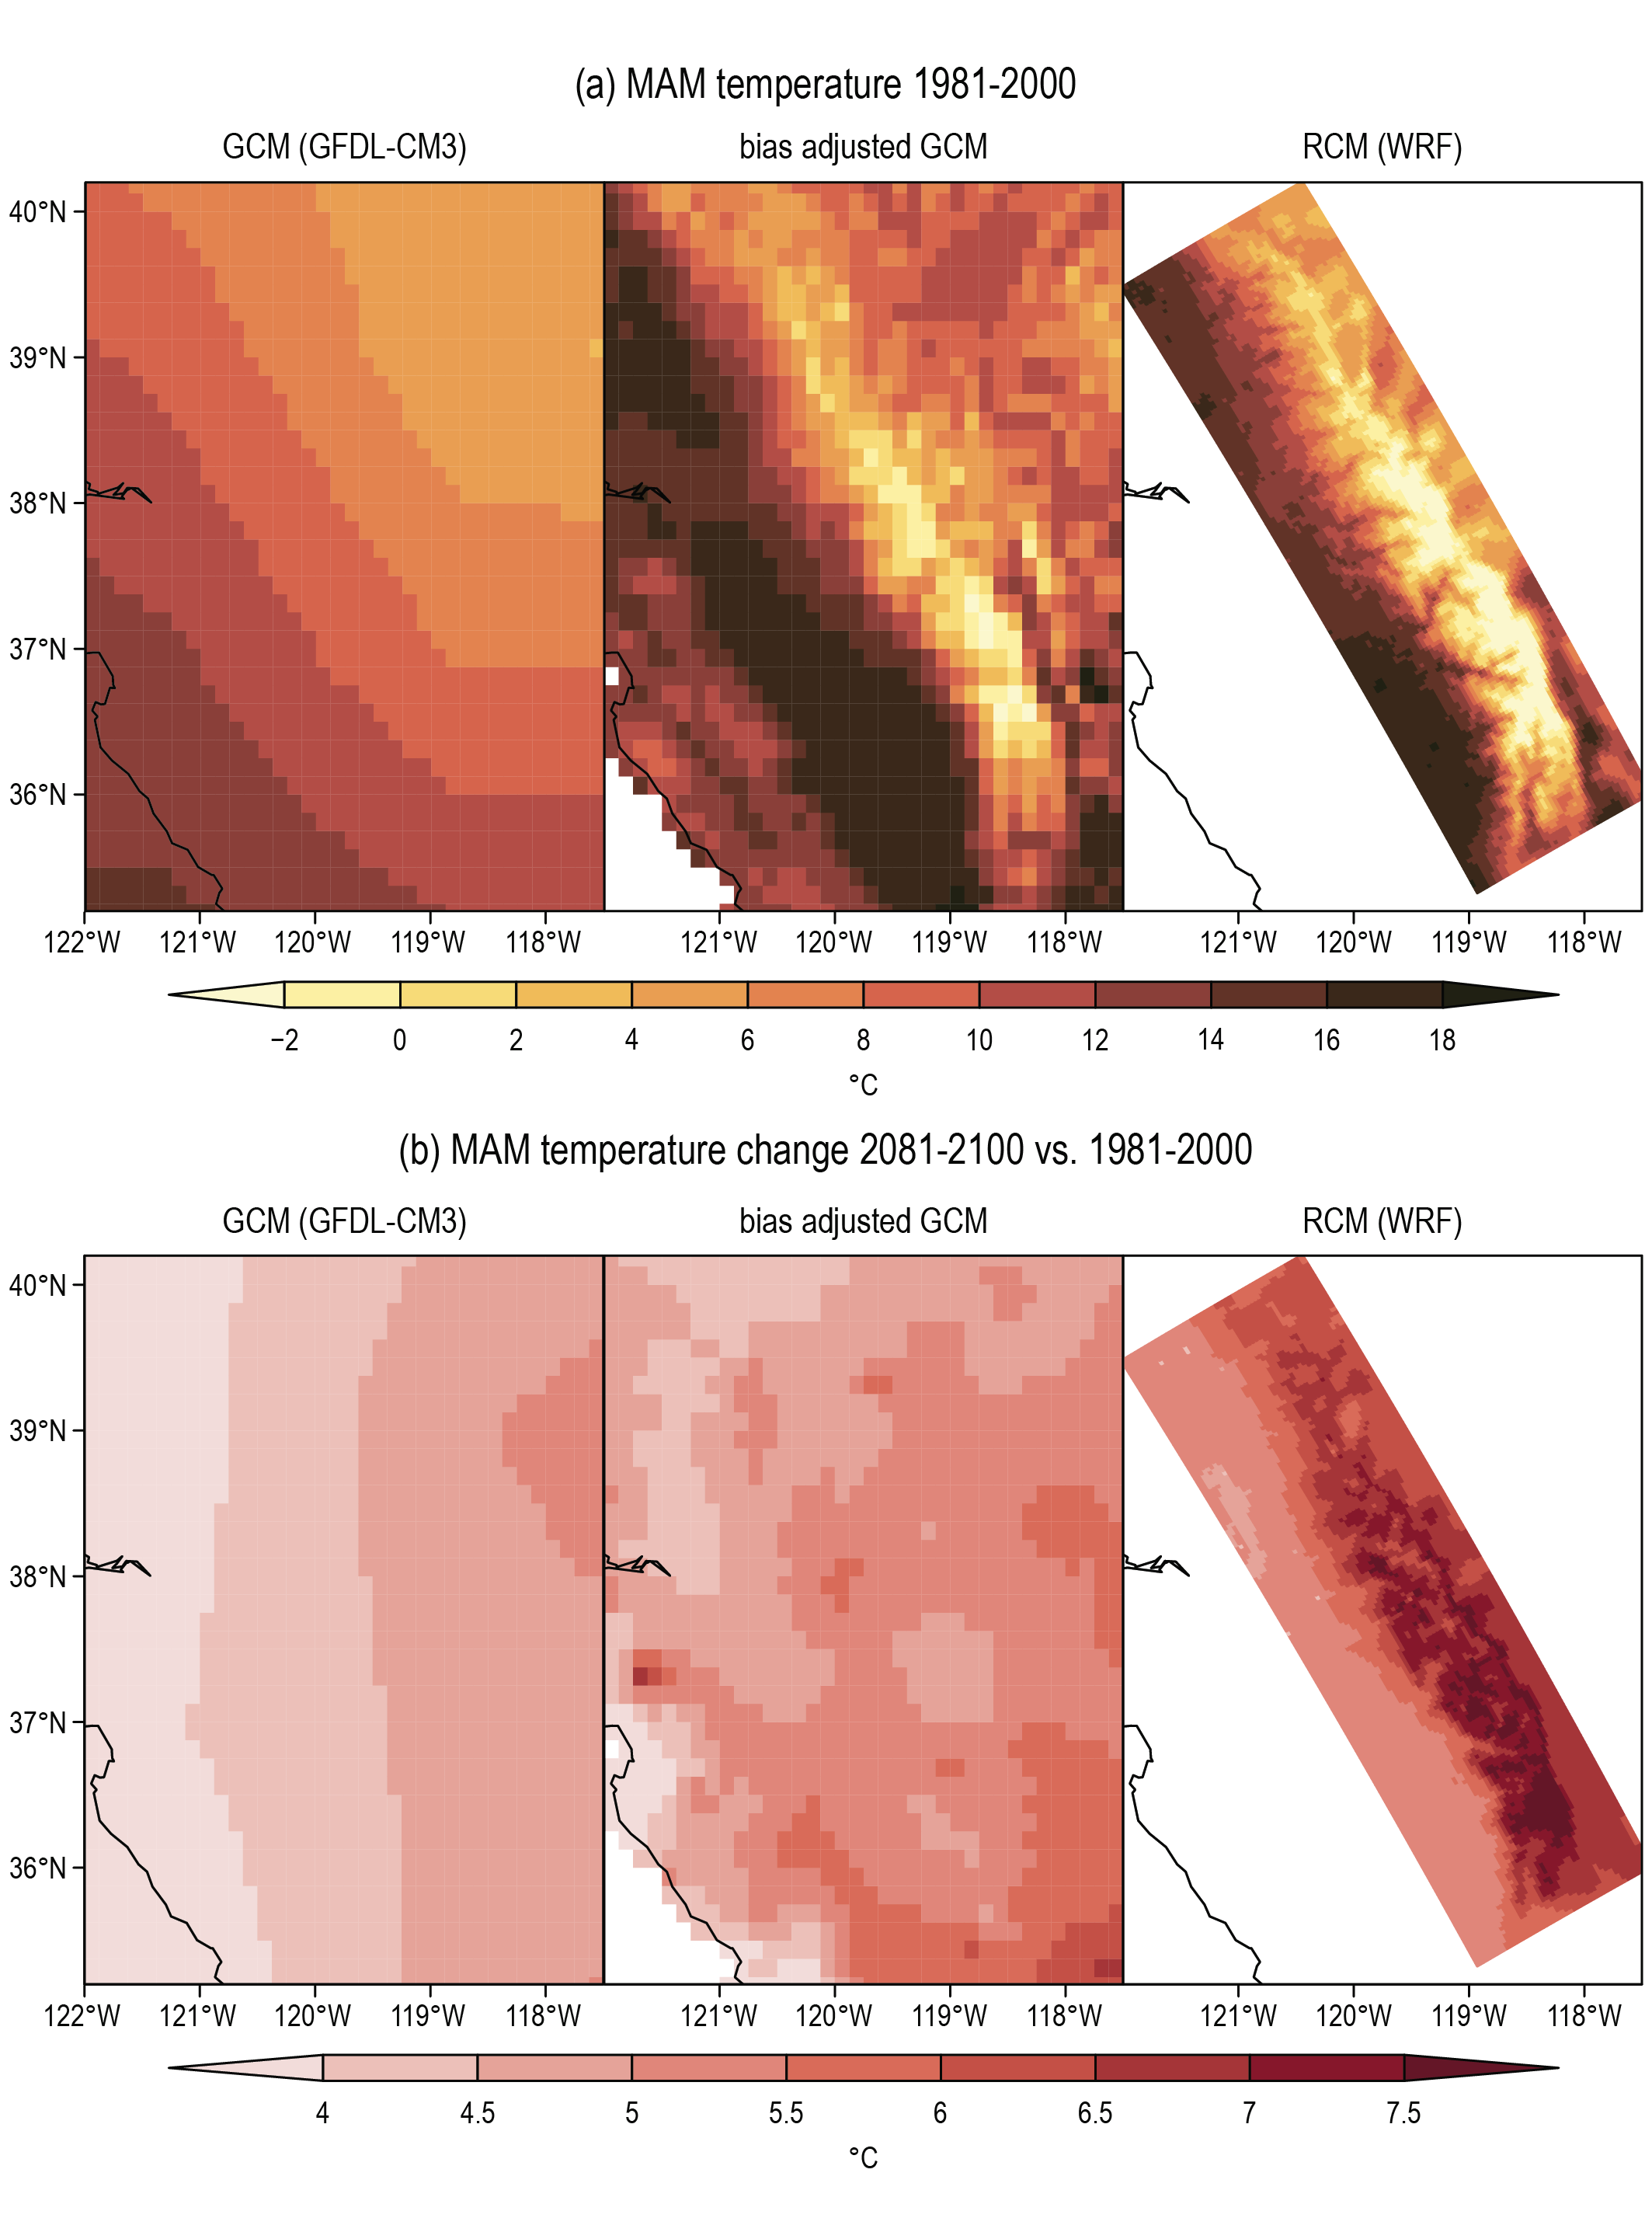
Figure caption
Cross-ChapterBox 10.2, Figure 1 | Boreal spring (March to May) daily mean surface air temperature in the Sierra Nevada region in California. (a) Present climate (1981–2000 average, in °C) in the GFDL-CM3 GCM, interpolated to 8 km (left), GCM bias adjusted (using quantile mapping) to observations at 8 km resolution (middle) and WRF RCM at 3 km horizontal resolution (right). (b) Climate change signal (2081–2100 average minus 1981–2000 average according to RCP8.5, in °C) in the GCM (left), the bias adjusted GCM (middle) and the RCM (right). Further details on data sources and processing are available in the chapter data table (Table 10.SM.11). Figure adapted from Maraun et al. (2017).