Cross-Chapter Box 10.4, Figure 1
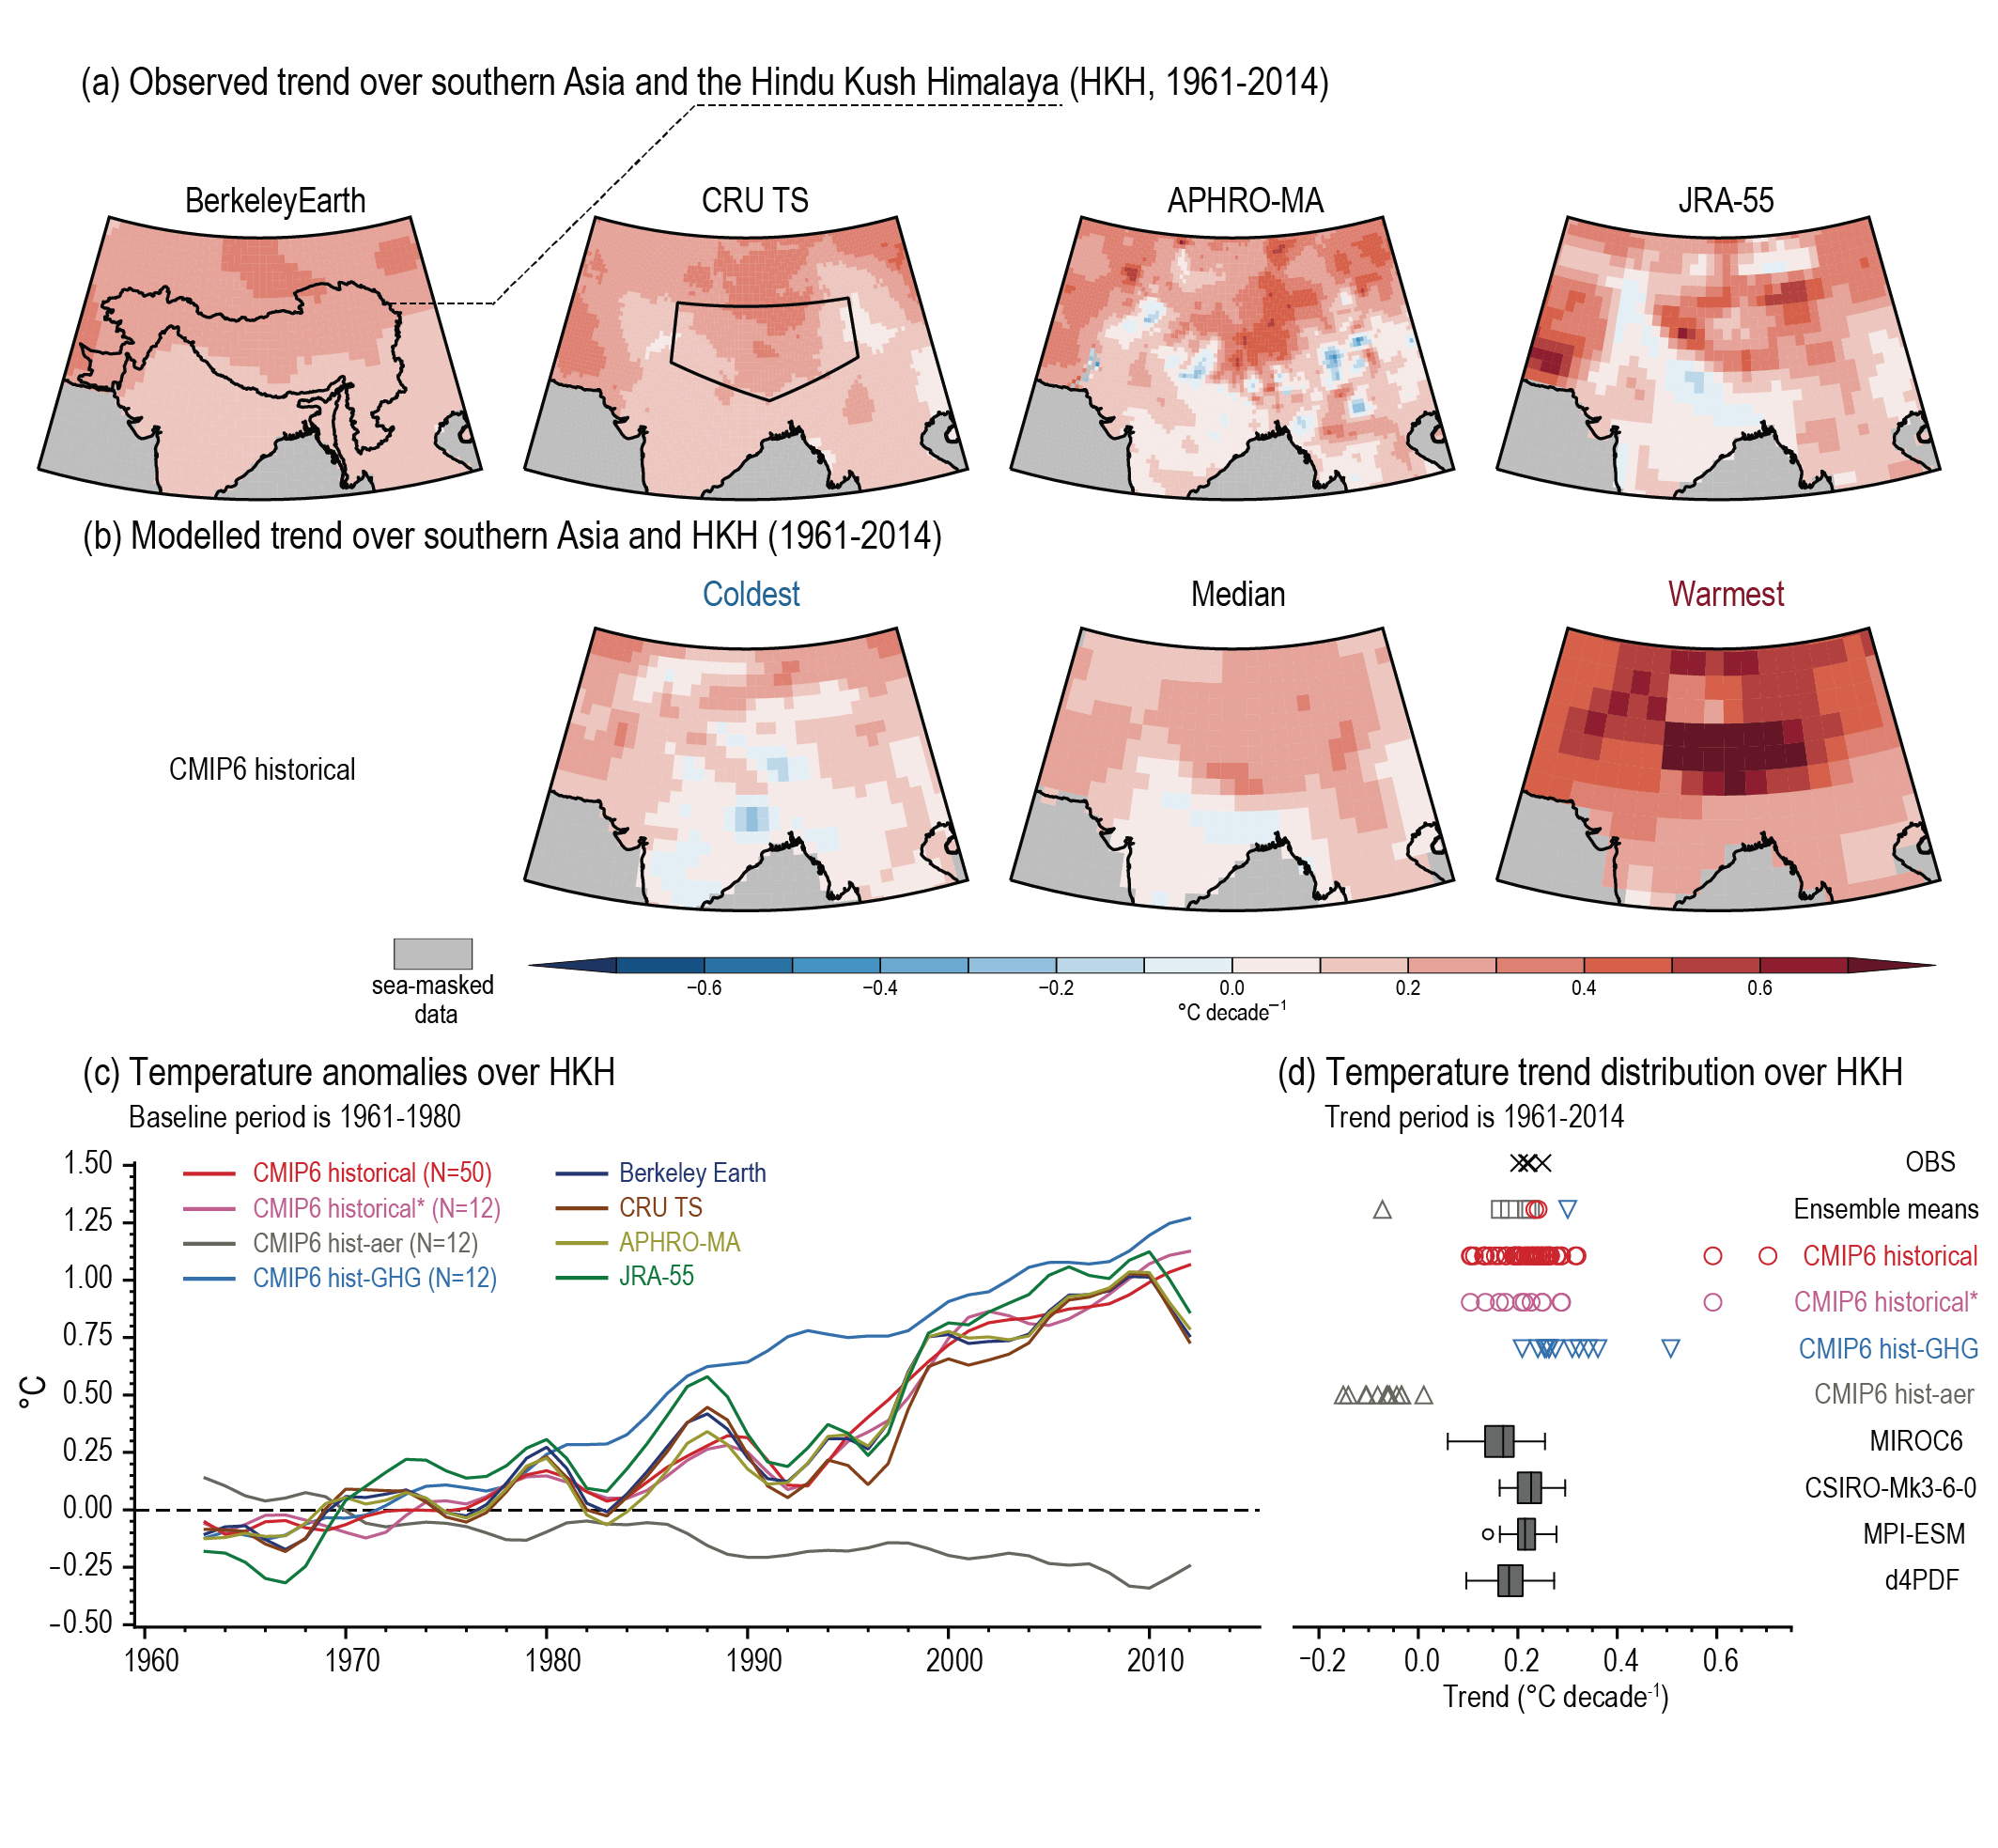
Figure caption
Cross-chapter Box 10.4, Figure 1 | Historical annual-mean surface air temperature linear trend (°C per decade) and its attribution over the Hindu Kush Himalaya (HKH) region. (a) Observed trends from Berkeley Earth (also showing the HKH outline), CRU TS (also showing the AR6 Tibetan Plateau (TIB) outline, for ease of comparison to the Interactive Atlas), APHRO-MA and JRA-55 datasets over 1961–2014. (b) Models showing the coldest, median and warmest HKH temperature linear trends among the CMIP6 historical ensemble over 1961–2014. (c) Low-pass-filtered time series of annual-mean surface air temperature anomalies (°C, baseline 1961–1980) over the HKH region as outlined in panel (a), showing means of CMIP6 hist all-forcings (red), and the CMIP6 hist all-forcings sample corresponding to DAMIP experiments (pink), for hist-aer (grey) and hist-GHG (pale blue). Observed datasets are Berkeley Earth (dark blue), CRU (brown), APHRO-MA (light green) and JRA-55 (dark green). The filter is the same as that used in Figure 10.10. (d) Distribution of annual mean surface air temperature trends (°C per decade) over the HKH region from 1961 to 2014 for ensemble means, the aforementioned observed and reanalysis data (black crosses), individual members of CMIP6 hist all-forcings (red circles), CMIP6 hist-GHG (blue triangles), CMIP6 hist-aer (grey triangles), and box-and-whisker plots for the SMILEs used throughout Chapter 10 (grey shading). Ensemble means are also shown. All trends are estimated using ordinary least-squares regression and box-and-whisker plots follow the methodology used in Figure 10.6. Further details on data sources and processing are available in the chapter data table (Table 10.SM.11).