Back chapter figures
Figure 10.10
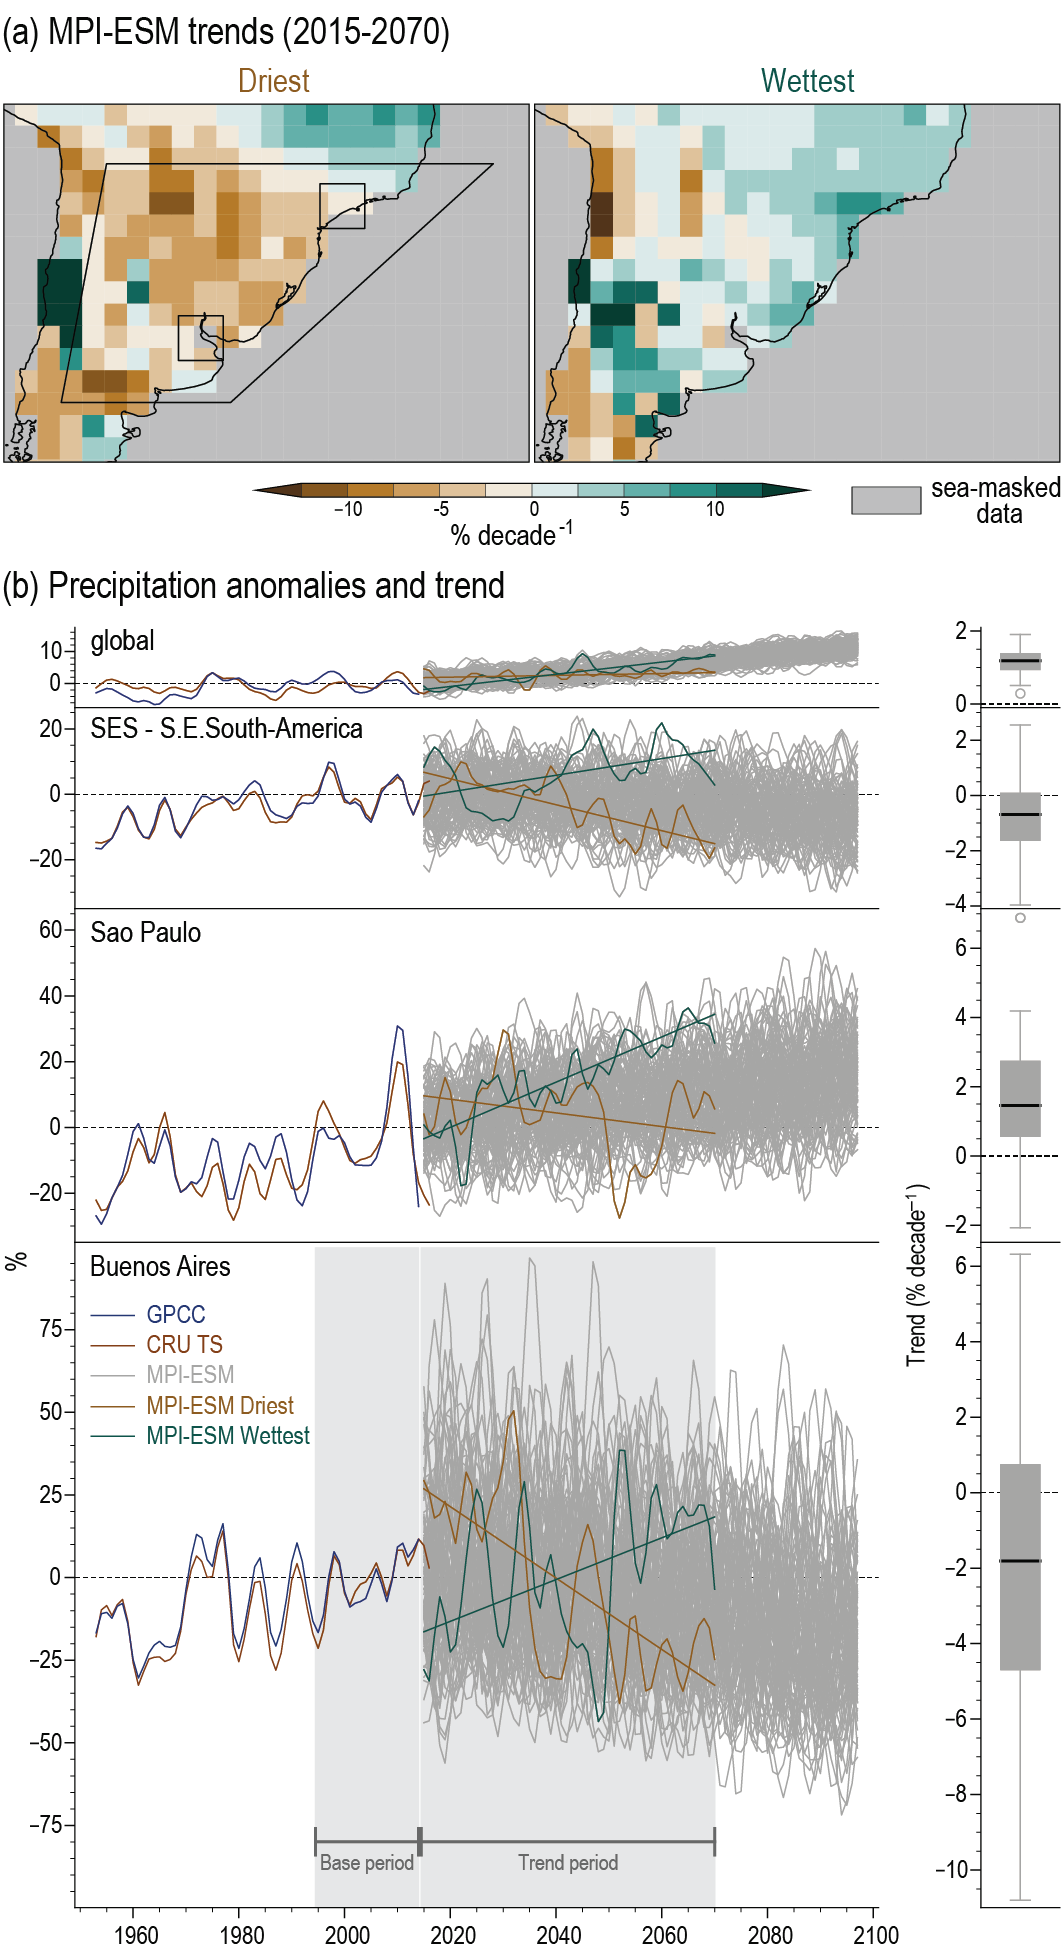
Figure caption
Figure 10.10 | Observed and projected changes in austral summer (December to February) mean precipitation in Global Precipitation Climatoloy Centre (GPCC), Climatic Research Unit Time Series (CRU TS) and 100 members of the Max Planck Institute for Meteorology Earth System Model (MPI-ESM. (a) 55-year trends (2015–2070) from the ensemble members with the lowest (left) and highest (right) trend (% per decade, baseline 1995–2014). (b) Time series (%, baseline 1995–2014) for different spatial scales (from top to bottom: global averages; South-Eastern South America; grid boxes close to São Paulo and Buenos Aires) with a five-point weighted running mean applied (a variant on the binomial filter with weights [1-3-4-3-1]). The brown (green) lines correspond to the ensemble member with weakest (strongest) 55-year trend and the grey lines to all remaining ensemble members. Box-and-whisker plots show the distribution of 55-year linear trends across all ensemble members, and follow the methodology used in Figure 10.6. Trends are estimated using ordinary least squares. Further details on data sources and processing are available in the chapter data table (Table 10.SM.11).