Back chapter figures
Figure 10.12
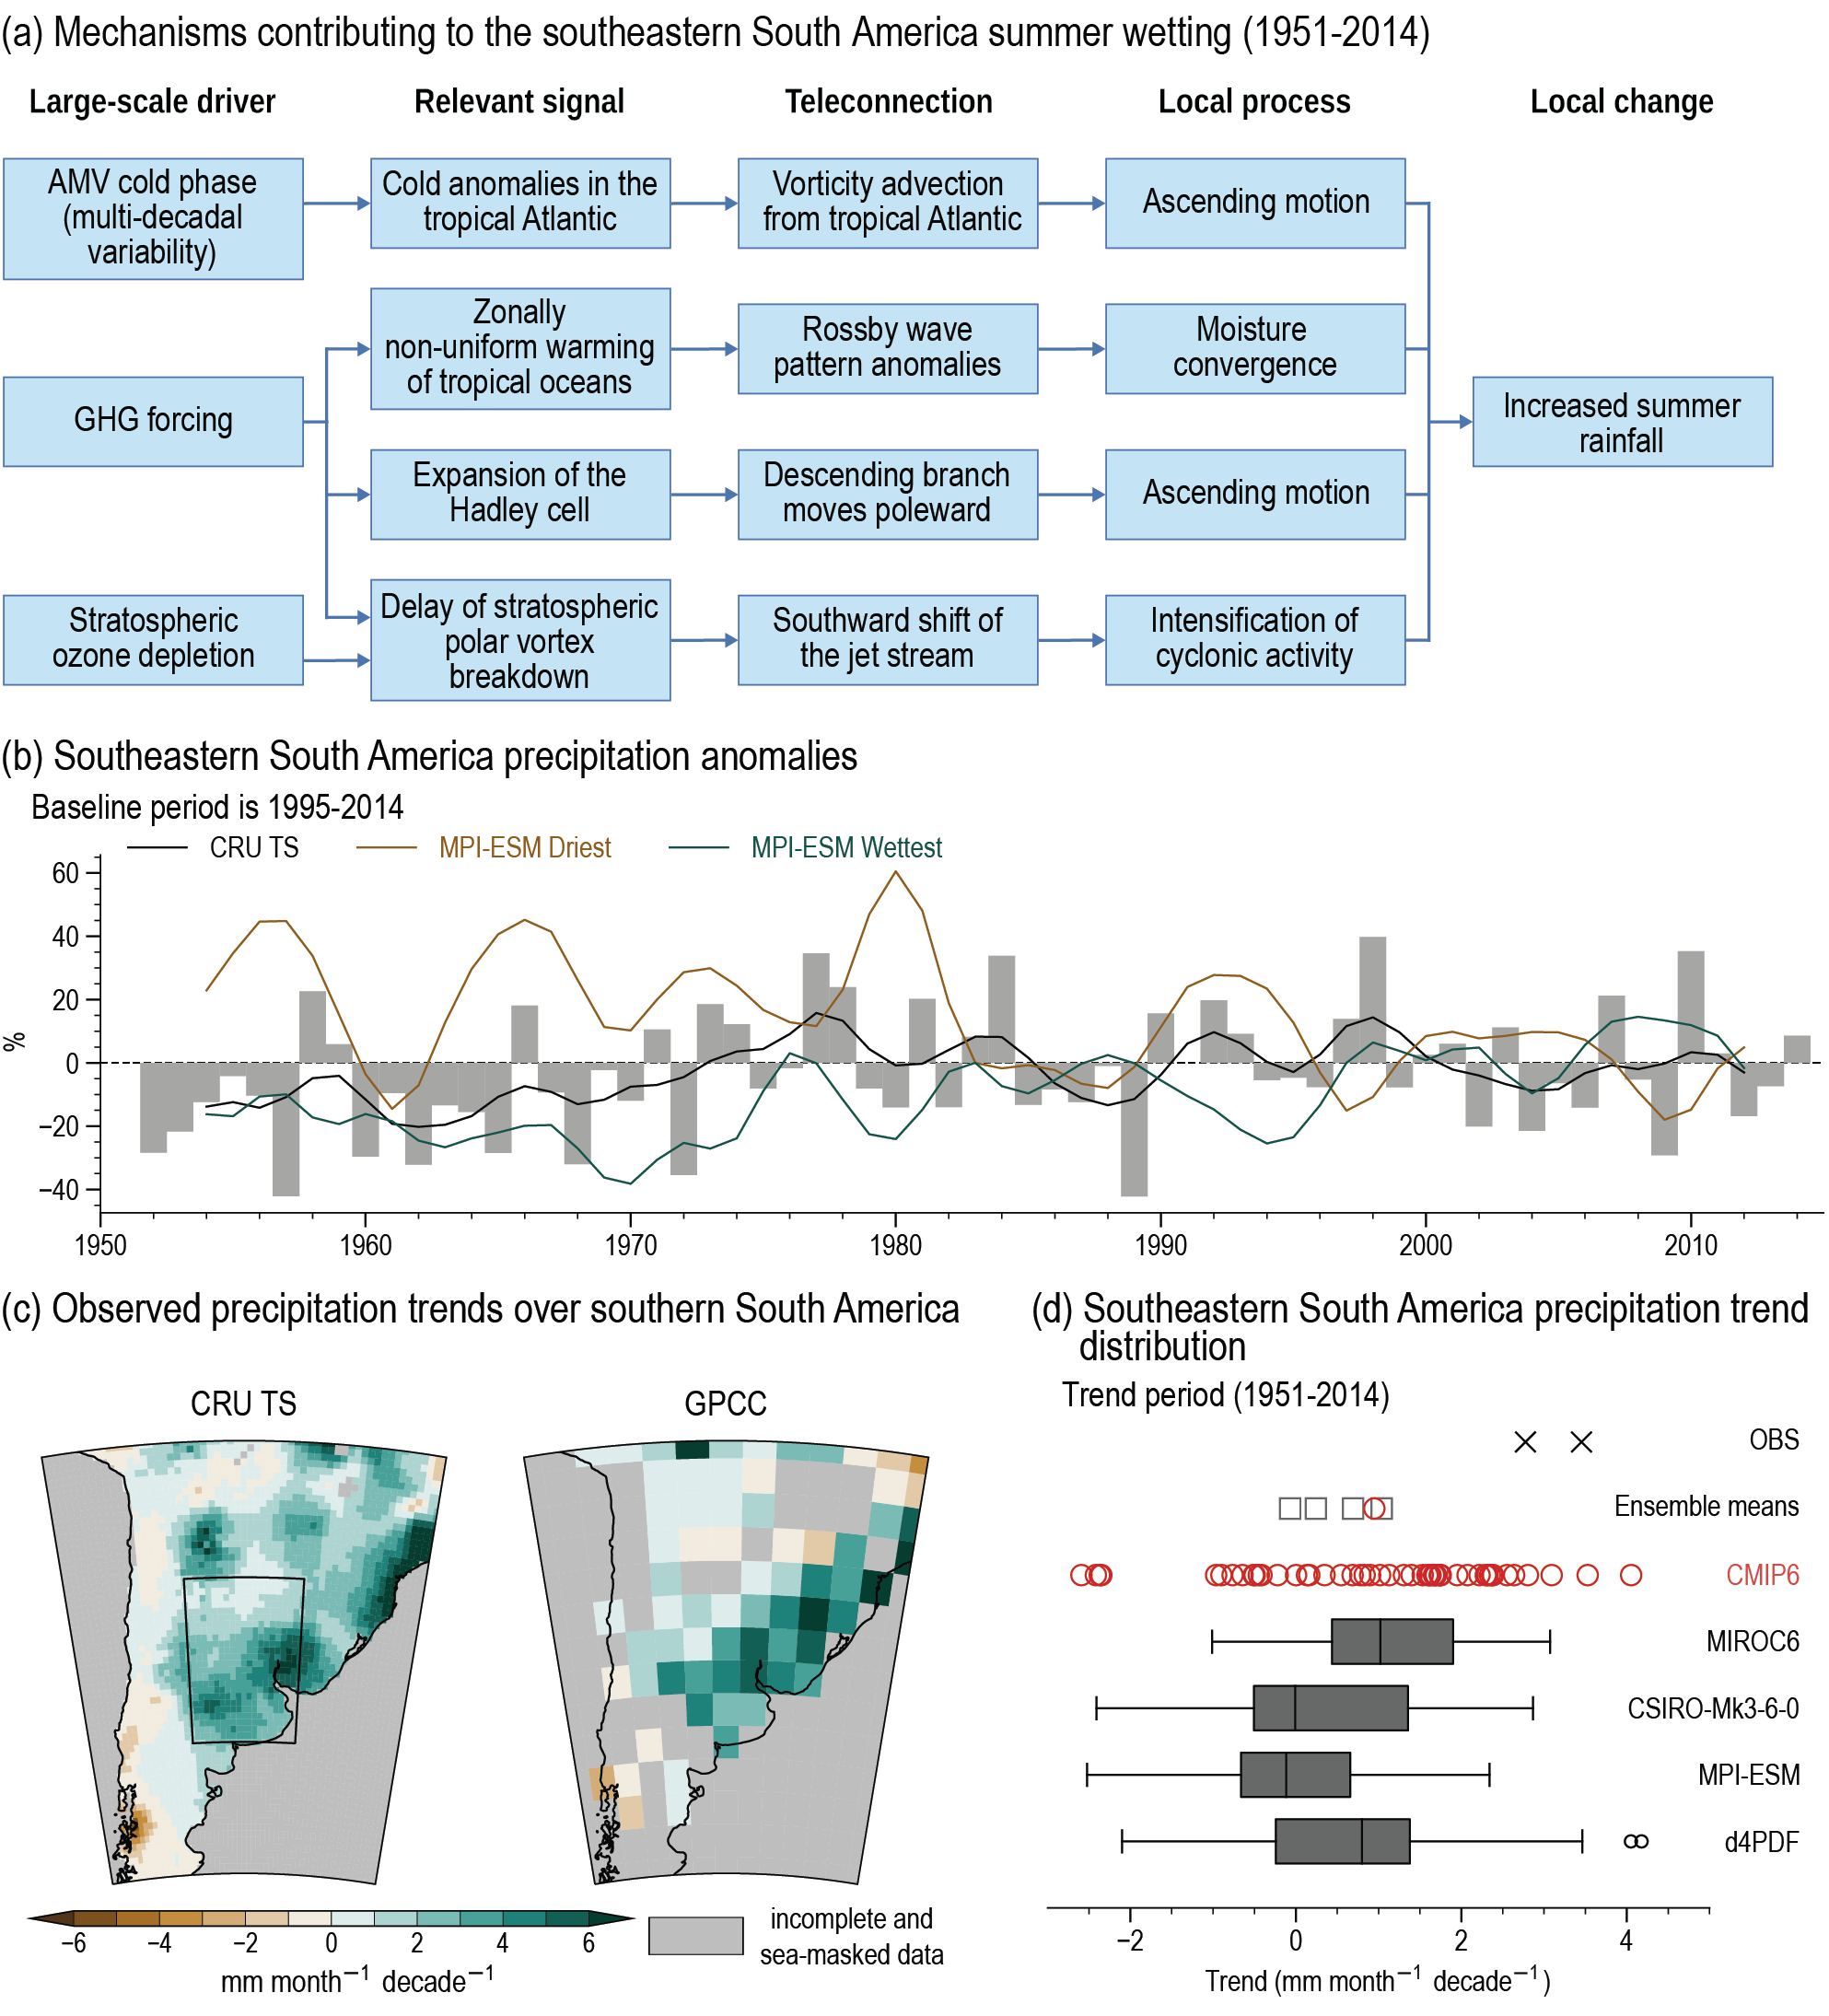
Figure caption
Figure 10.12 | South-Eastern South America positive mean precipitation trend and its drivers during 1951–2014. (a) Mechanisms that have been suggested to contribute to South-Eastern South America summer wetting. (b) Time series of austral summer (December to February) precipitation anomalies (%, baseline 1995–2014) over the South-Eastern South American region (26.25°S–38.75°S, 56.25°W–66.25°W), black quadrilateral in the first map of panel (c). Black, brown and green lines show low-pass filtered time series for CRU TS), and the members with driest and wettest trends of the MPI-ESM single-model initial-condition large ensemble (SMILE; between 1951–2014), respectively. The filter is the same as the one used in Figure 10.10. (c) Mean austral summer precipitation spatial linear 1951–2014 trends (mm per month and decade) from CRU TS and GPCC. Trends are estimated using ordinary least squares regression. (d) Distribution of precipitation 1951–2014 trends over South-Eastern South America from GPCC and CRU TS (black crosses), CMIP6 all-forcing historical (red circles) and MIROC6, CSIRO-Mk3-6-0, MPI-ESM and d4PDF SMILEs (grey box-and-whisker plots). Grey squares refer to ensemble mean trends of their respective SMILE and the red circle refers to the CMIP6 multi-model mean. Box-and-whisker plots follow the methodology used in Figure 10.6. Further details on data sources and processing are available in the chapter data table (Table 10.SM.11).