Back chapter figures
Figure 10.13
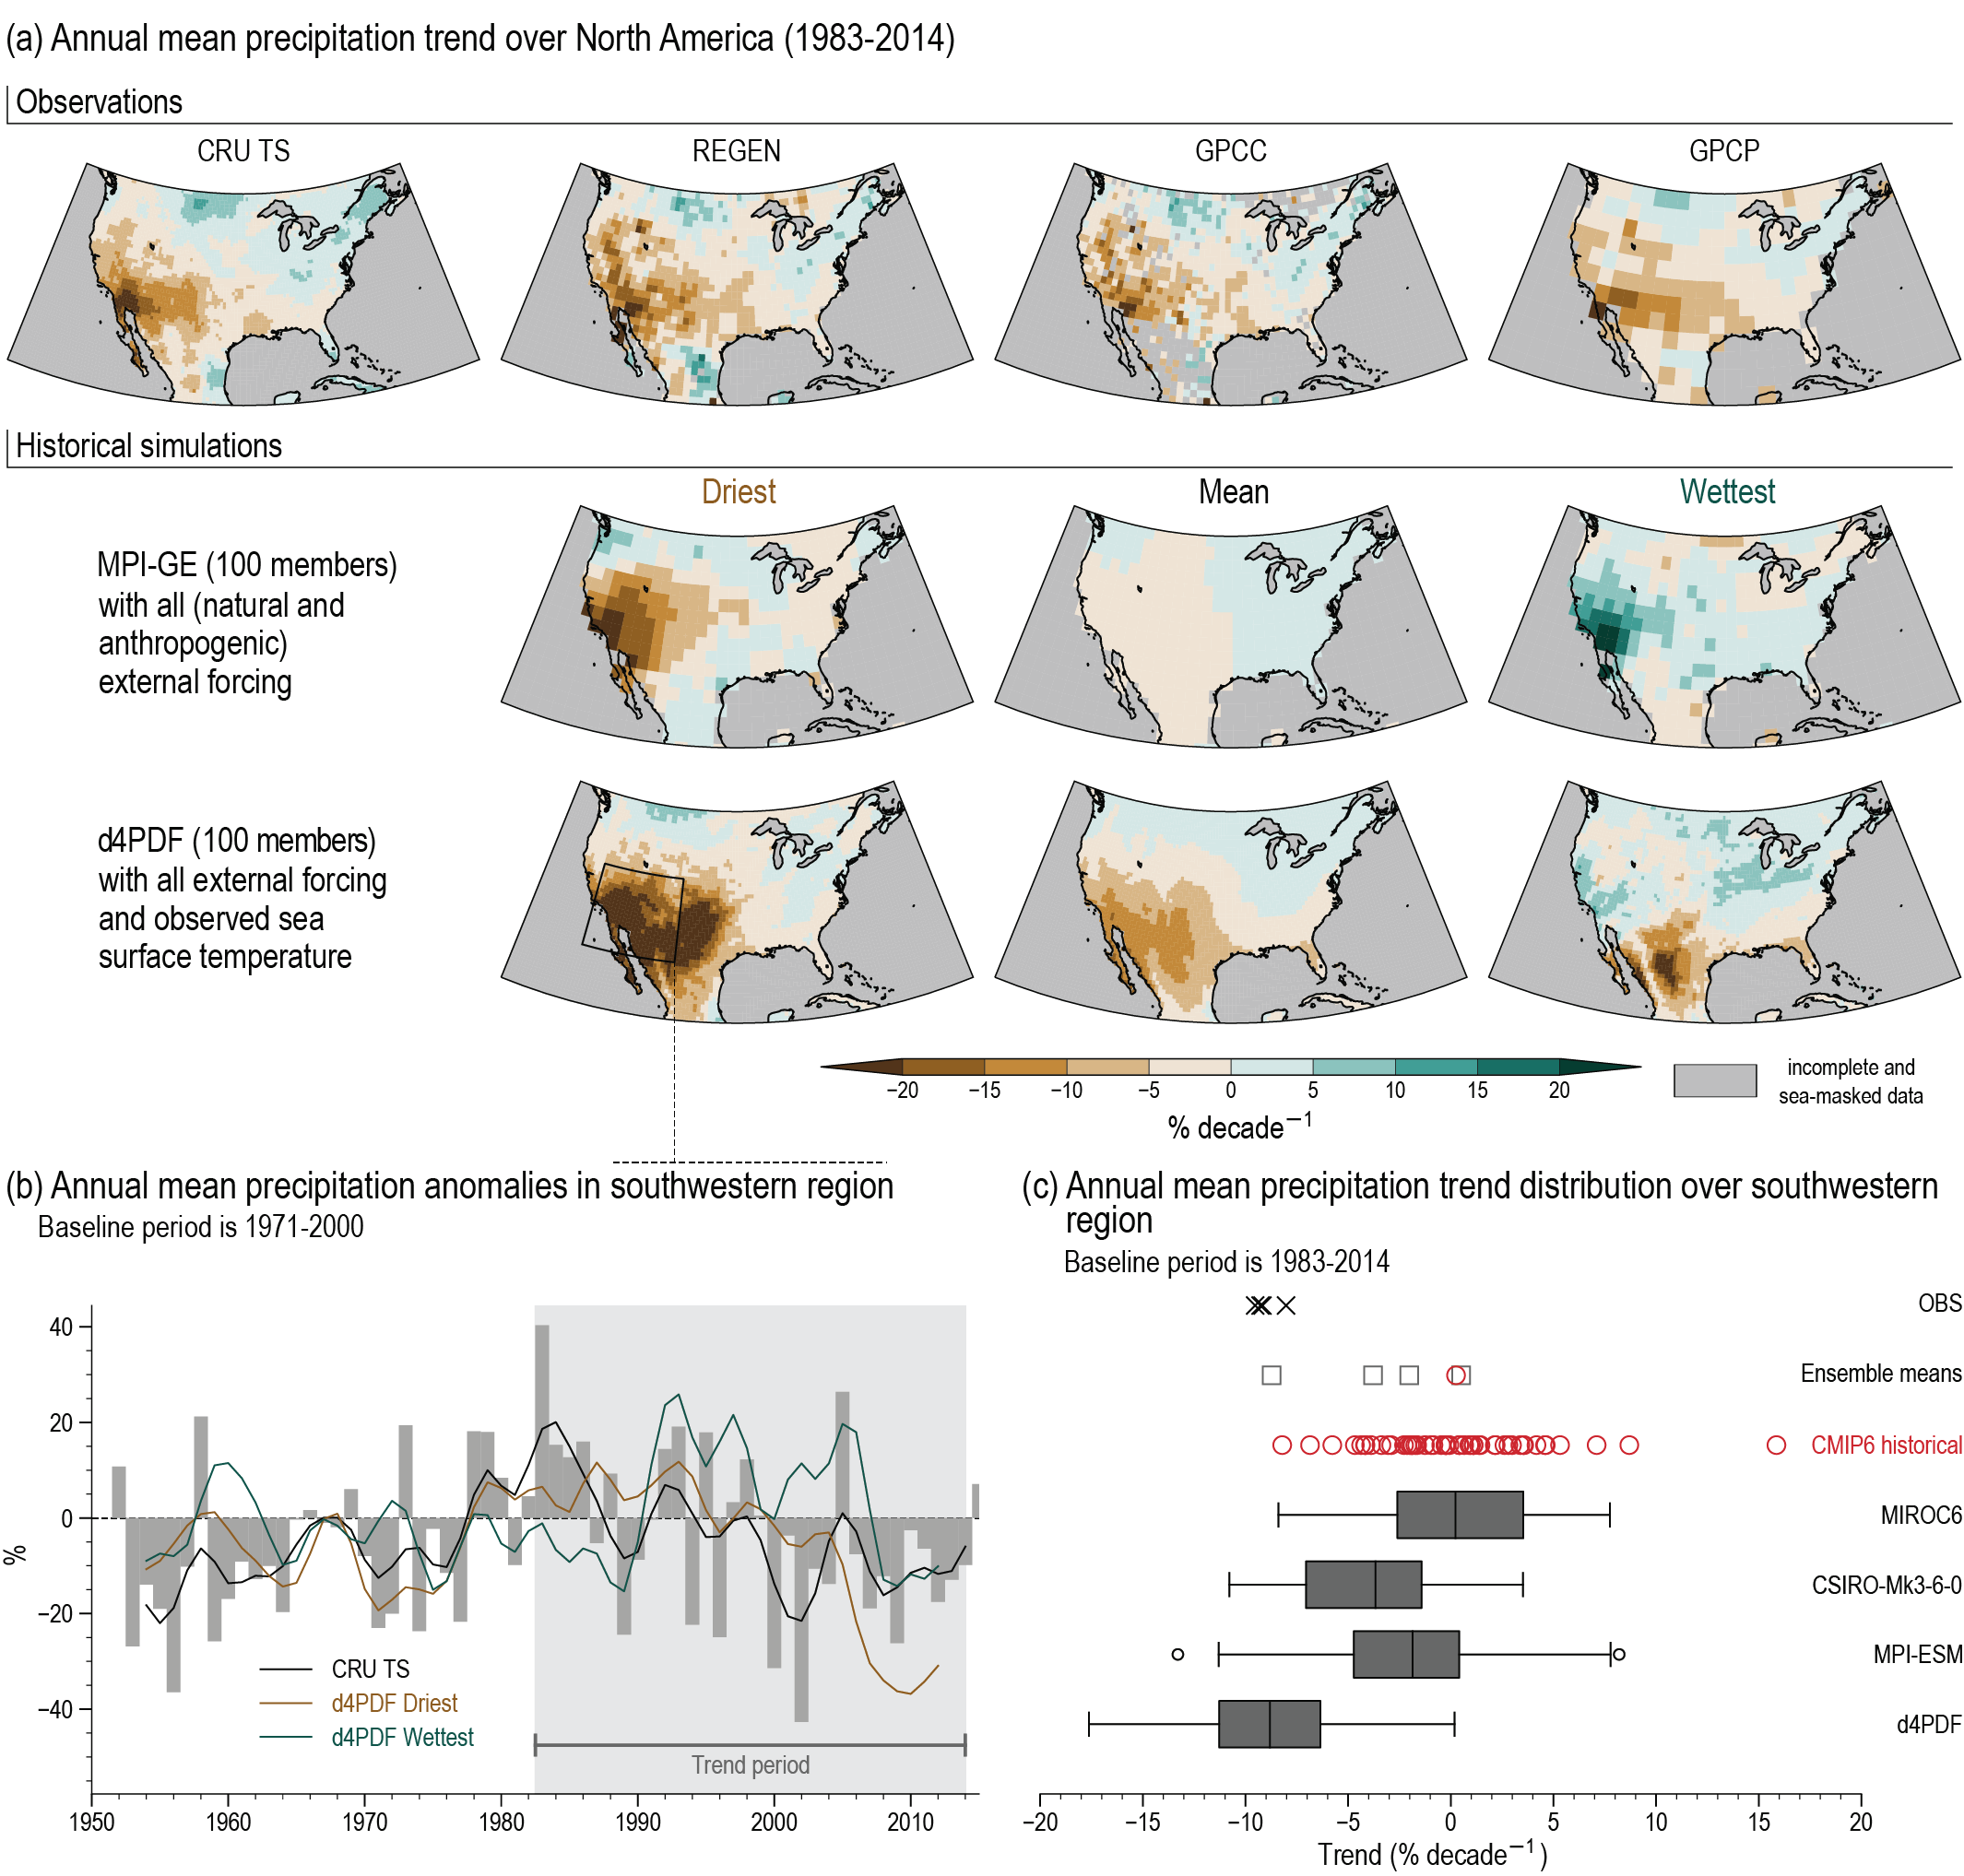
Figure caption
Figure 10.13 | Attribution of the south-western North America precipitation decline during the 1983–2014 period. (a) Water year (October to September) precipitation spatial linear trend (in percent per decade) over North America from 1983 to 2014. Trends are estimated using ordinary least squares. Top row: observed trends from CRU TS, REGEN, GPCC, and the Global Precipitation Climatology Project (GPCP). Middle row: driest, mean and wettest trends (relative to the region enclosed in the black quadrilateral, bottom row) from the 100 members of the MPI-ESM coupled SMILE. Bottom row: driest, mean and wettest trends relative to the above region from the 100 members of the d4PDF atmosphere-only SMILE. (b) Time series of water year precipitation anomalies (%, baseline 1971–2000) over the above south-western North America region for CRU TS (grey bar charts). Black, brown and green lines show low-pass filtered time series for CRU TS, driest and wettest members of the d4PDF SMILE, respectively. The filter is the same as the one used in Figure 10.10. (c) Distribution of south-western region-averaged water-year precipitation 1983–2014 trends (in percent per decade) for observations (CRU TS, REGEN, GPCC and GPCP, black crosses), CMIP6 all-forcing historical simulations (red circles), the MIROC6, CSIRO-Mk3-6-0, MPI-ESM and d4PDF SMILEs (grey box-and-whisker plots). Grey squares refer to ensemble mean trends of their respective SMILE and the red circle refers to the CMIP6 multi-model mean. Box-and-whisker plots follow the methodology used in Figure 10.6. Further details on data sources and processing are available in the chapter data table (Table 10.SM.11).