Back chapter figures
Figure 10.14
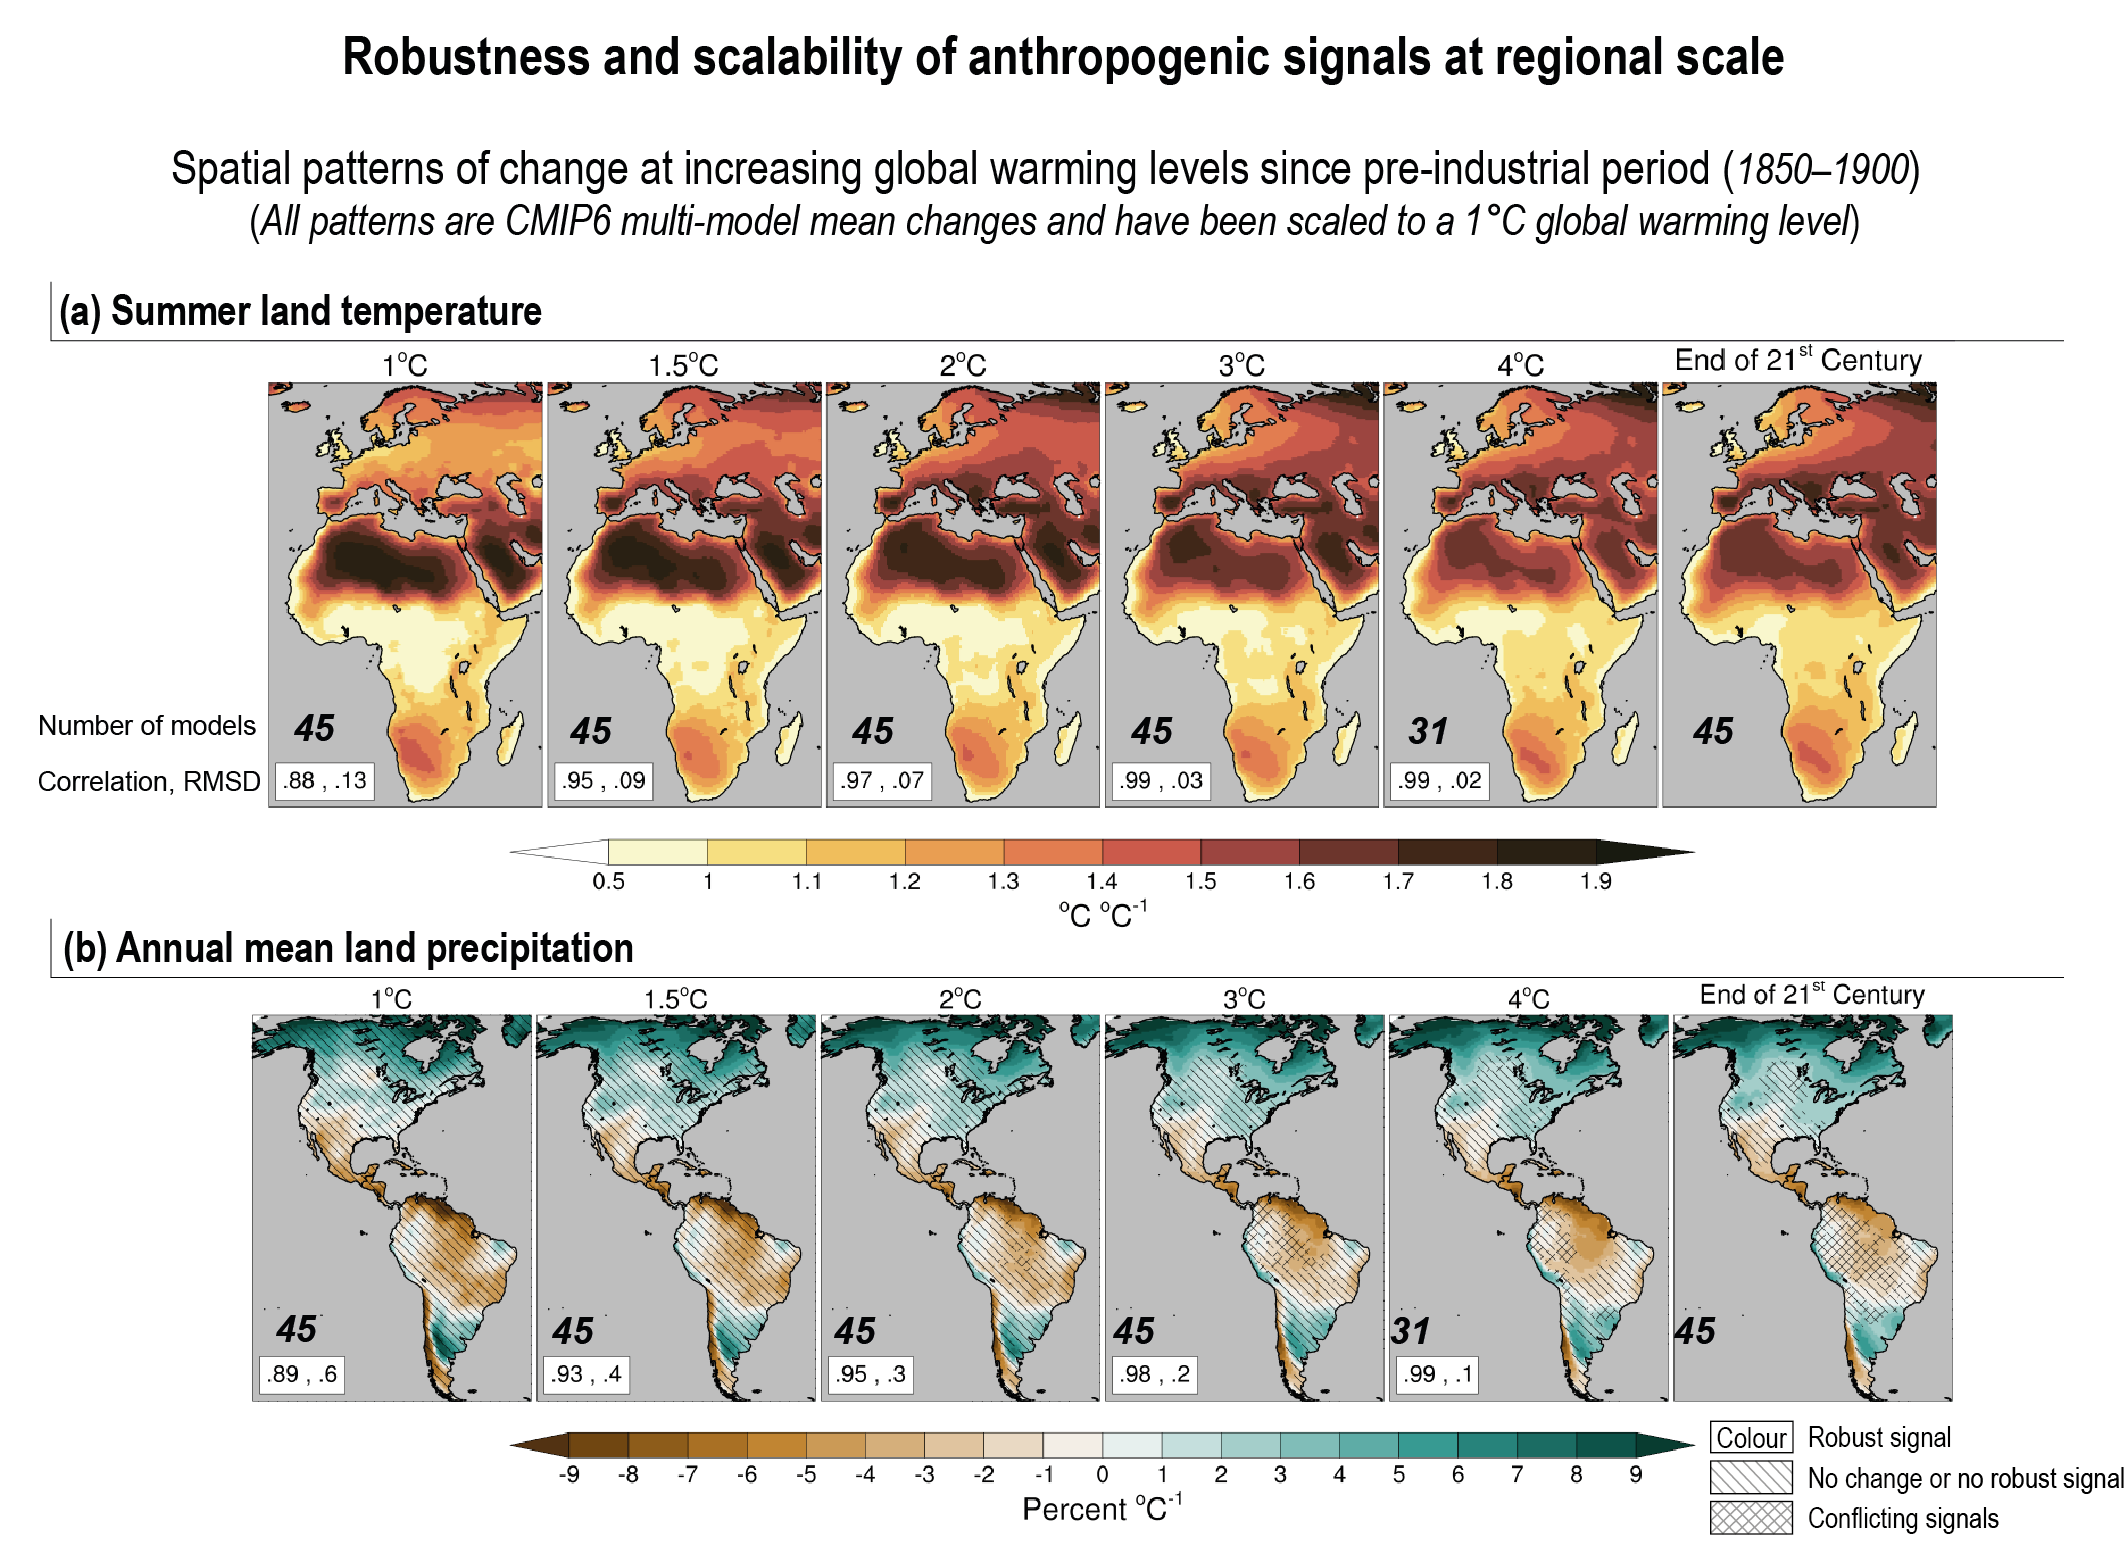
Figure caption
Figure 10.14 | Robustness and scalability of anthropogenic signals at regional scale. (a) Spatial patterns of European and African summer (June to August) surface air temperature change (in °C °C–1) from the Coupled Model Intercomparison Project Phase 6 (CMIP6) multi-model mean (45 models, one member per model, historical simulations and scenario SSP5-8.5) at different global warming levels (GWLs) and the end-21st century scaling pattern estimated from the multi-model mean difference between 2081–2100 and the pre-industrial period (1850–1900) divided by the corresponding global mean warming. The scale of all GWL patterns has been adjusted to a global mean warming of 1°C (for example, the resulting 3°C spatial pattern has been divided by three). The scales of the GWL patterns have to be multiplied by their threshold values to obtain the actual simulated warming. The metrics shown in the bottom left corner of the GWL pattern plots indicate the spatial pattern correlation and the root-mean-square difference between the GWL patterns and the scaling pattern. The number in bold just above the metrics gives the number of used CMIP6 models (out of 45) that have reached the GWL threshold. Areas with robust change (at least 66% of the models have a signal-to-noise ratio greater than one and 80% or more of the models agree on the sign of the change) are coloured with no pattern overlaid (Cross-Chapter Box Atlas.1). Areas with a significant change (at least 66% of the models have a signal-to-noise ratio greater than one) and lack of model agreement (meaning that less than 80% of the models agree on the sign of the change) are marked by cross-hatching. Areas with no change or no robust change (less than 66% of the models have a signal-to-noise ratio greater than one) are marked by negatively sloped hatching. (b) Same as (a) but for North, Central and South America annual mean precipitation relative change (percent °C–1). The baseline for precipitation climatology is 1850–1900. Further details on data sources and processing are available in the chapter data table (Table 10.SM.11).