Back chapter figures
Figure 10.15
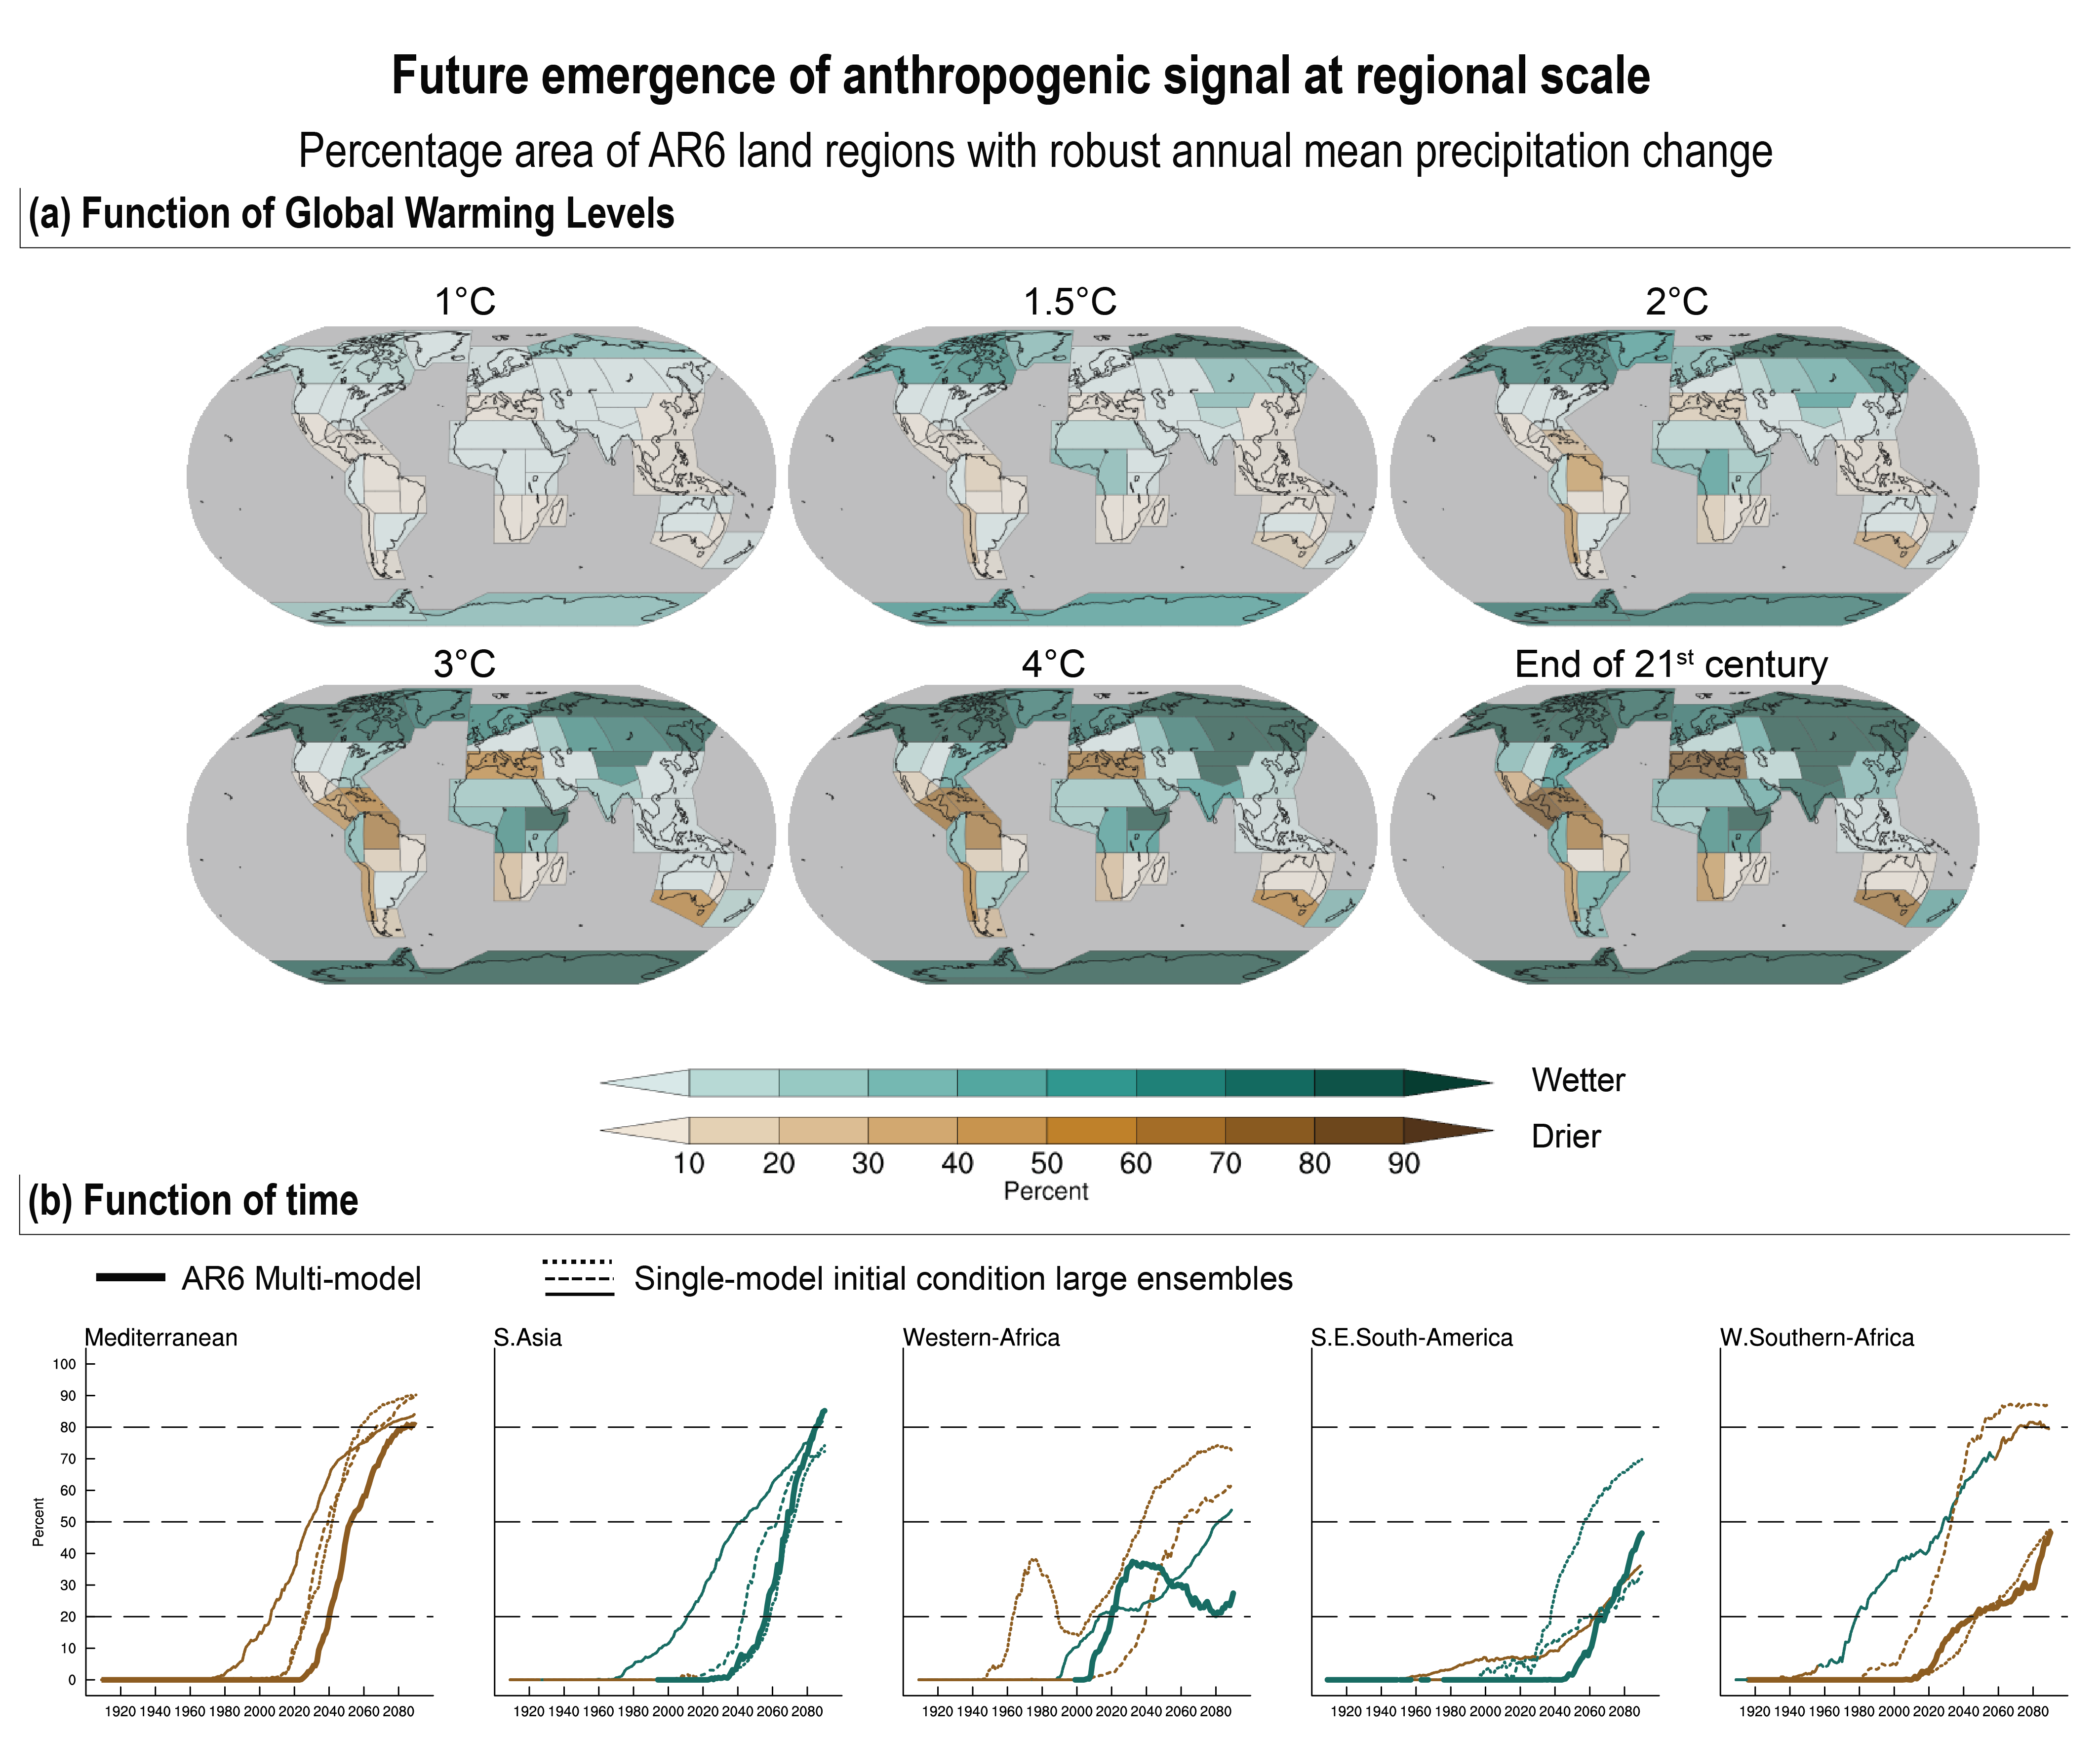
Figure caption
Figure 10.15 | Future emergence of anthropogenic signal at regional scale. (a) Percentage area of land regions with robust annual mean precipitation change as a function of increasing global warming levels (GWLs). Robustness of the precipitation change is first estimated at each grid-point followed by the estimation of the AR6 region area with robust changes. For each Coupled Model Intercomparison Project Phase 6 (CMIP6) model considered (45 models, one member per model, historical simulations and scenario SSP5-8.5), the annual mean precipitation change is based on the difference between a 20-year average centred on the GWL crossing year and the mean precipitation during the pre-industrial period (1850–1900) taken as a reference. The change is considered to be robust when at least 66% of the models (30 out of 45) have a signal-to-noise ratio greater than one and at least 80% of them (36 out of 45) agree on the sign of change. The signal-to-noise ratio is estimated for each model from the ratio between the change and the standard deviation of non-overlapping 20-year means of the corresponding pre-industrial simulation (scaled by square root of 2 times 1.645). (b) Time evolution of the percentage area of land region with robust annual mean precipitation change for five AR6 land regions. Thick solid lines represent precipitation changes based on the same CMIP6 ensemble as in (a). Thin solid, dotted and dashed lines represent changes based on the three coupled single-model initial-condition large ensembles (SMILEs) used in Chapter 10, illustrating the influence of internal variability on the emergence of robust change. The change is estimated from the difference between all consecutive 20-year periods from 1900–1919 up to 2081–2100 and the pre-industrial period. The line colour indicates the sign of the robust change given by the multi-model mean (CMIP6) or ensemble mean (SMILE) change: brown (decreasing precipitation) and dark green (increasing precipitation). Further details on data sources and processing are available in the chapter data table (Table 10.SM.11).