Back chapter figures
Figure 10.18
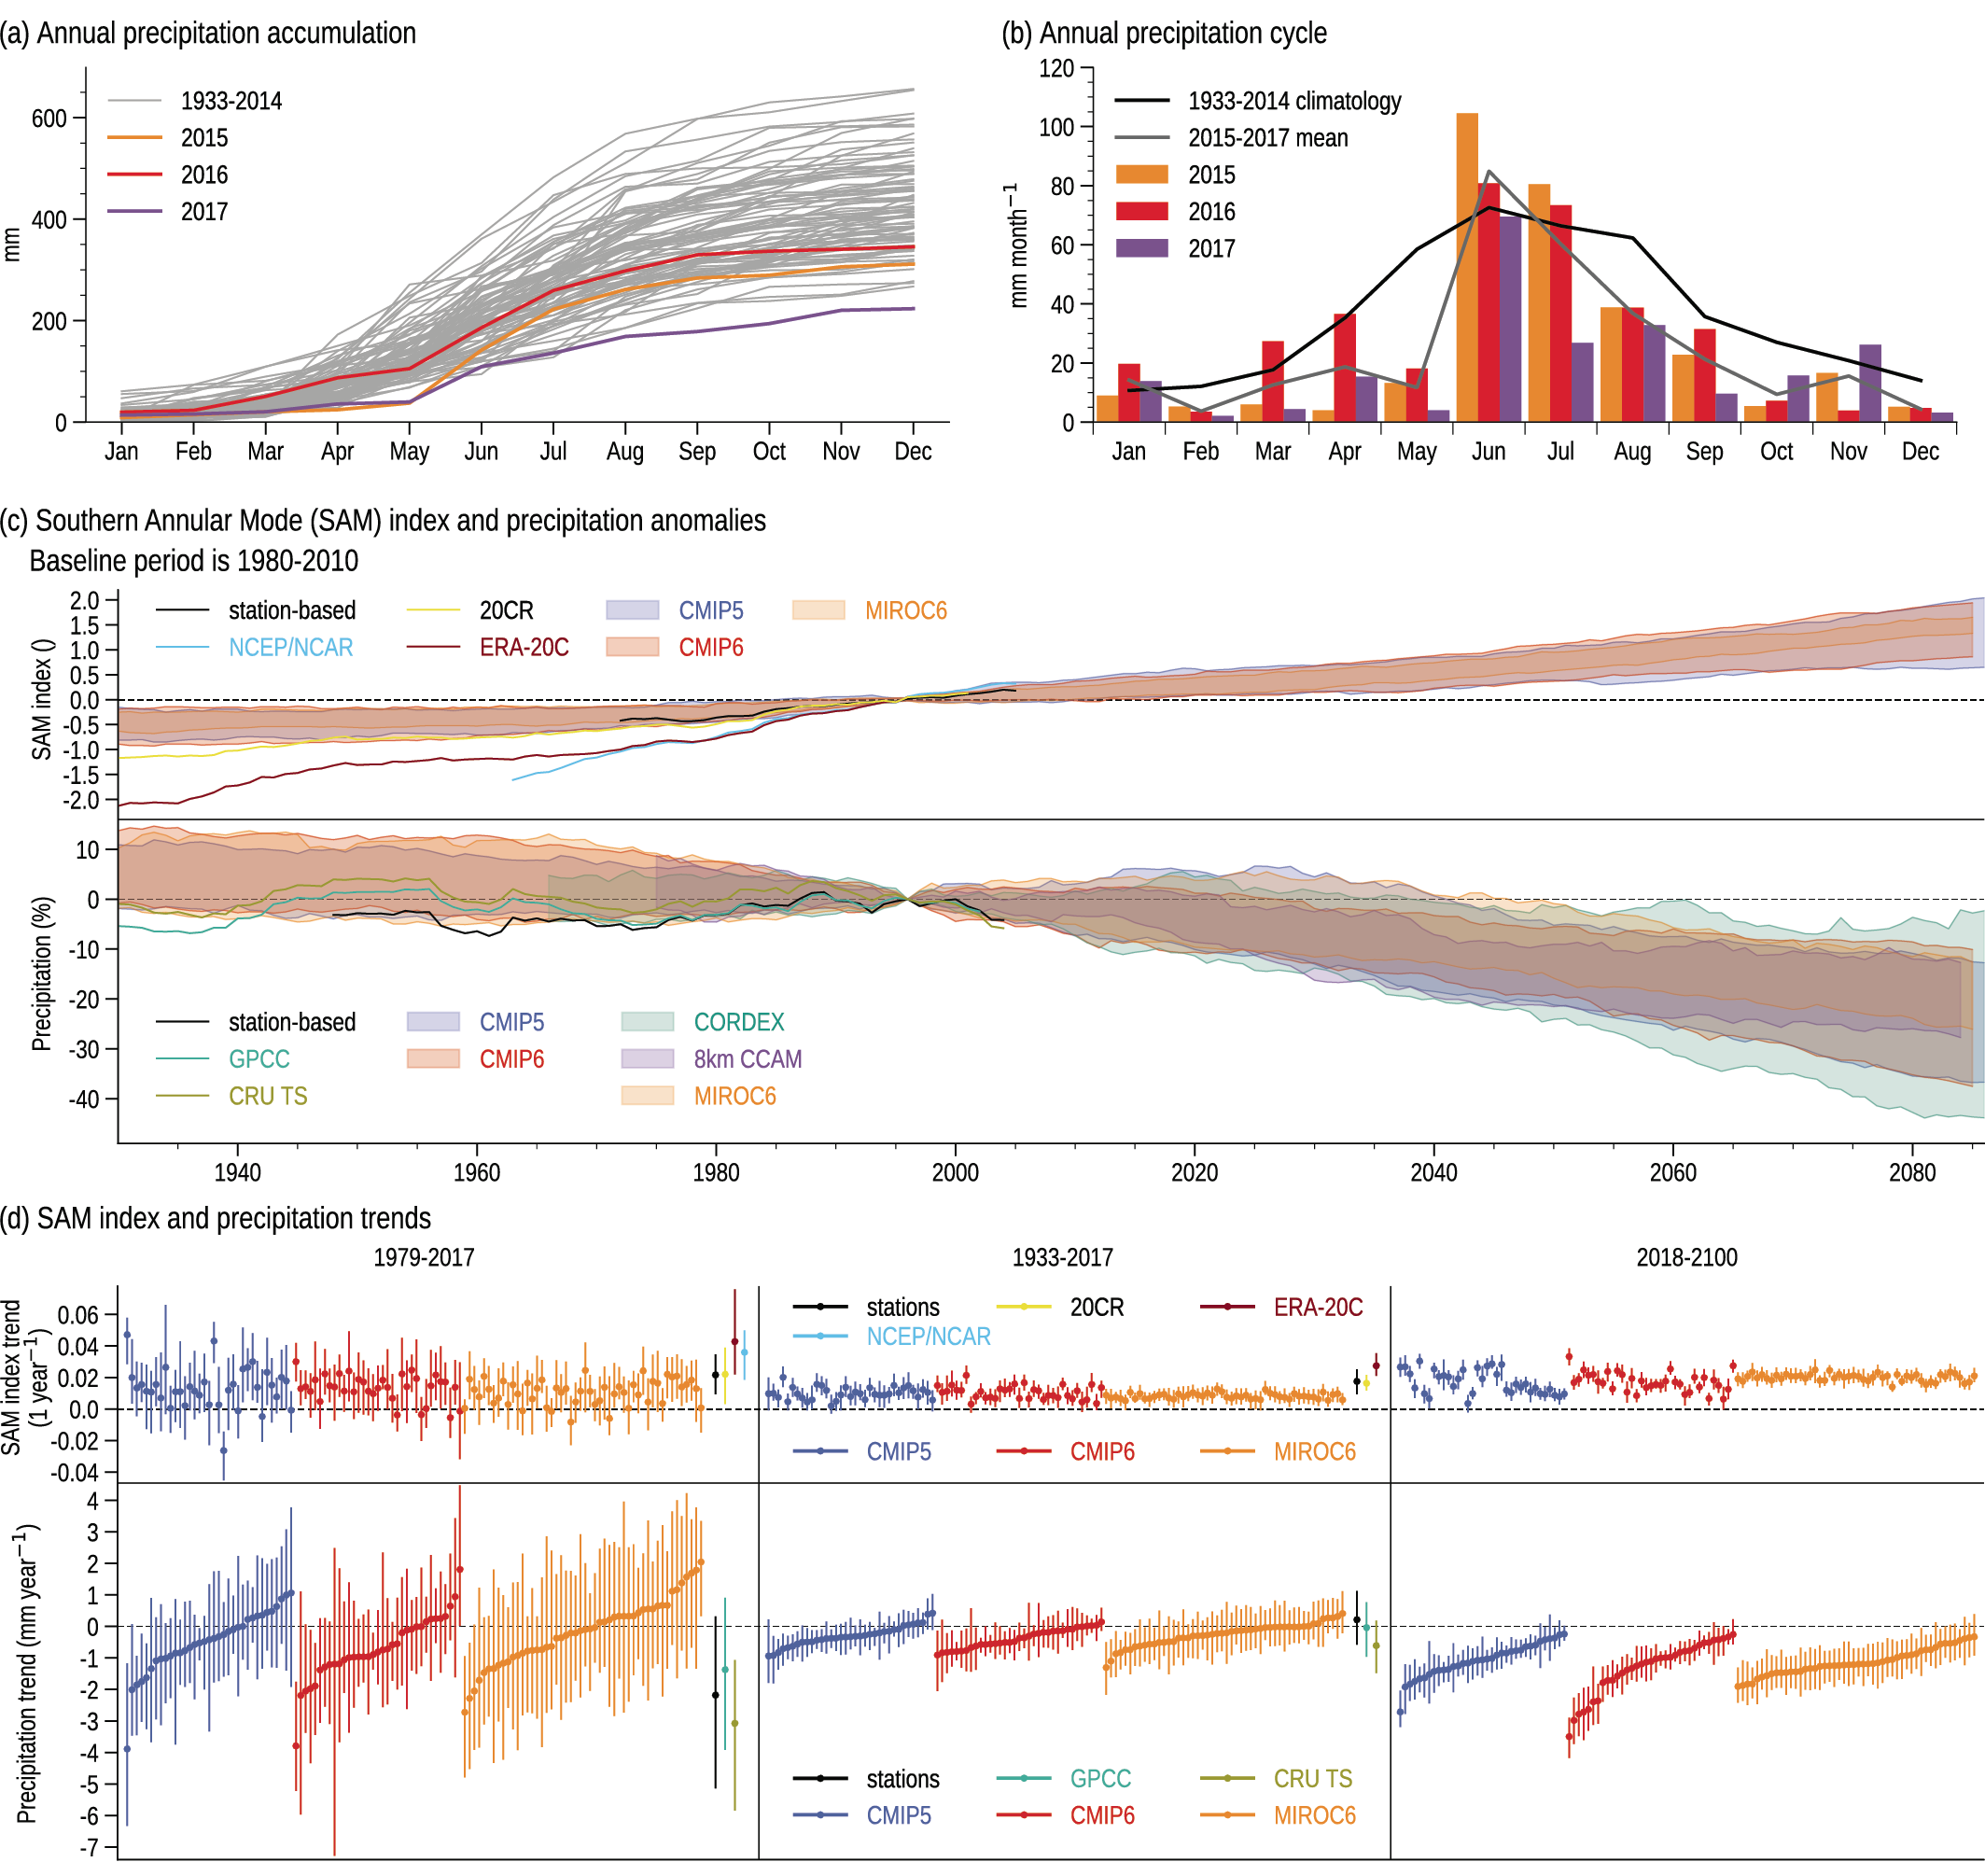
Figure caption
Figure 10.18 | Historical and projected rainfall and Southern Annular Mode (SAM) over the Cape Town region. (a) Yearly accumulation of rainfall (in mm) obtained by summing monthly totals between January and December, with the drought years 2015 (orange), 2016 (red), and 2017 (purple) highlighted in colour. (b) Monthly rainfall for the drought years (in colour) compared with the 1981–2014 climatology (grey line). Rainfall in (a) and (b) is the average of 20 quality controlled and gap-filled series from stations within the Cape Town region (31°S–35°S, 18°W–20.5°W). (c) Time series of the SAM index and of historical and projected rainfall anomalies (%, baseline 1980–2010) over the Cape Town region. Observed data presented as 30-year running means of relative total annual rainfall over the Cape Town region for station-based data (black line, average of 20 stations as in (a) and (b), and gridded data (average of all gridcells falling within 31°S–35°S, 18°W–20.5°W), GPCC (green line) and CRU TS (olive line). Model ensemble results presented as the 90th-percentile range of relative 30-year running means of rainfall and the SAM index from 35 CMIP5 (blue shading) and 35 CMIP6 (red shading) simulations, 6 CORDEX simulations driven by 1 to 10 GCMs (cyan shading), 6 CCAM (purple shading) simulations from individual ensemble members, and 50 members from the MIROC6 SMILE simulations (orange shading). The light blue, dark red and yellow lines correspond to NCEP/NCAR, ERA20C and 20CR, respectively. The SAM index is calculated from sea level pressure reanalysis and GCM data as per Gong and Wang (1999) and averaged over the aforementioned bounding box. CMIP5, CORDEX and CCAM projections use RCP8.5, and CMIP6 and MIROC6 SMILE projections use SSP5-8.5. (d) Historical and projected trends in rainfall over the Cape Town region and in the SAM index. Observations and gridded data processed as in (c). Trends calculated as Theil-Sen trend with block-bootstrap confidence interval estimate. Markers show median trend, bars 95% confidence interval. Global models in each CMIP group were ordered according to the magnitude of trend in rainfall, and the same order is maintained in panels showing trends in the SAM. Further details on data sources and processing are available in the chapter data table (Table 10.SM.11).