Back chapter figures
Figure 10.21
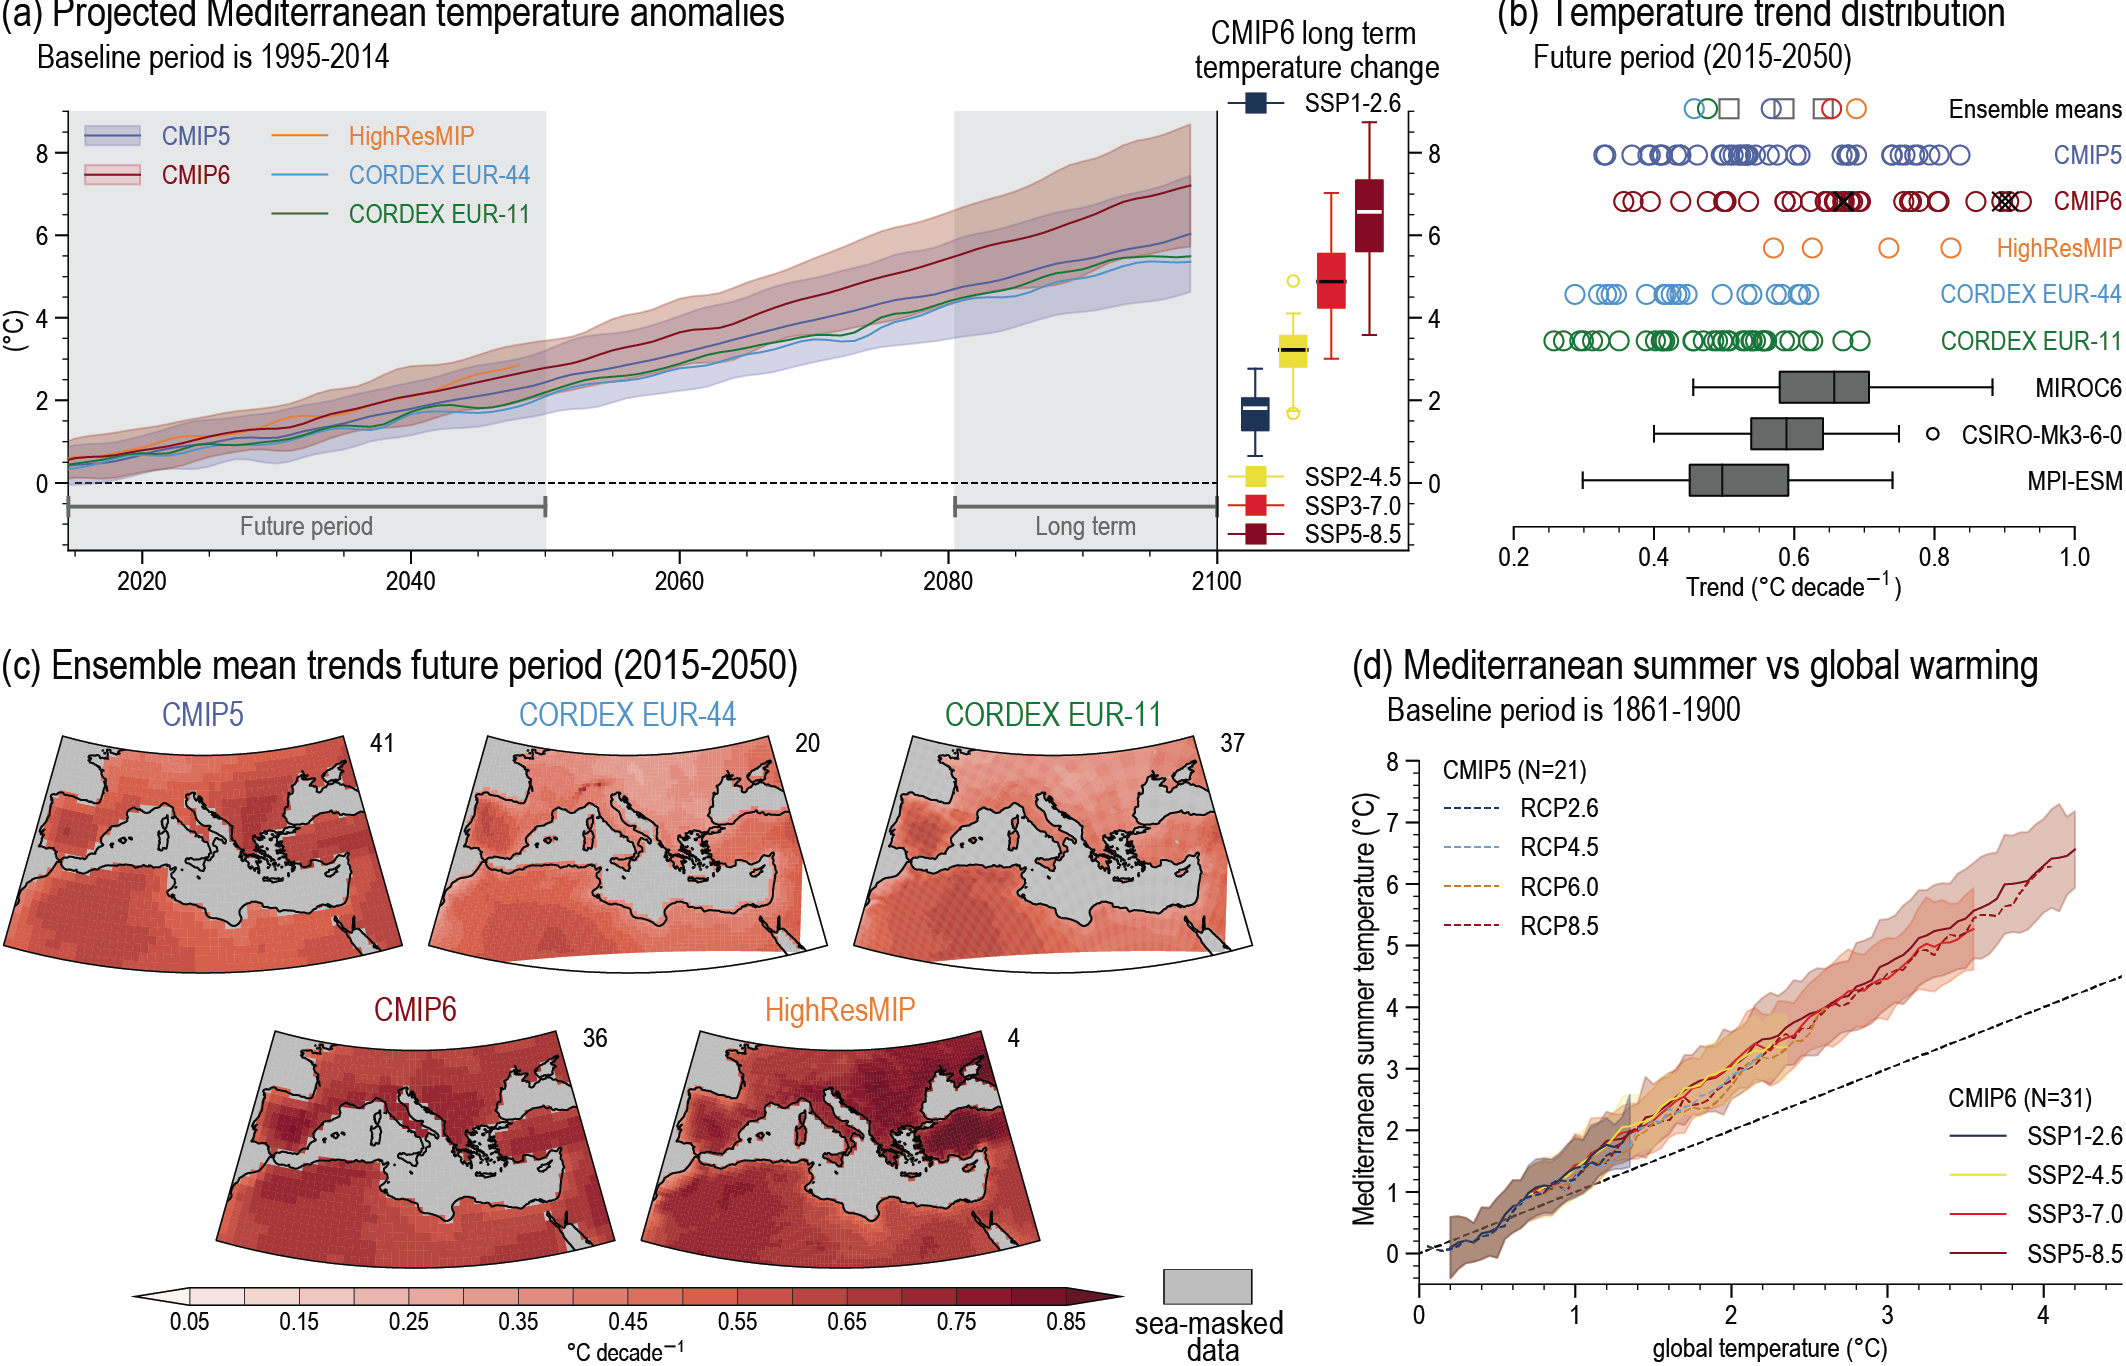
Figure caption
Figure 10. 21 | Projected Mediterranean summer warming. (a) Time series of area averaged Mediterranean (25°N–50°N, 10°W–40°E) land point summer surface air temperature anomalies (°C, baseline period is 1995–2014). Orange, light blue and green lines show low-pass filtered ensemble means of HighResMIP (highres-future, four members), CORDEX EUR-44 (RCP8.5, 20 members) and CORDEX EUR-11 (RCP8.5, 37 members). Blue and dark red lines and shadings show low-pass filtered ensemble means and standard deviations of CMIP5 (RCP8.5, 41 members) and CMIP6 (SSP5-8.5, 36 members). The filter is the same as the one used in Figure 10.10. The box-and-whisker plots show long-term (until 2081–2100) temperature changes of different CMIP6 scenarios with respect to the baseline period (SSP1-2.6 in dark blue, SSP2-4.5 in yellow, SSP3-7.0 in red, SSP5-8.5 in dark red). (b) Distribution of 2015–2050 Mediterranean summer temperature linear trends (°C per decade) for CORDEX EUR-11 (RCP8.5, green circles), CORDEX EUR-44 (RCP8.5, light blue circles), HighResMIP (highres-future, orange circles), CMIP6 (SSP5-8.5, dark red circles), CMIP5 (RCP8.5, blue circles) and selected SMILEs (grey box-and-whisker plots, MIROC6, CSIRO-Mk3-6-0 and MPI-ESM). Ensemble means are also shown. CMIP6 models showing a very high ECS (Box 4.1) have been marked with a black cross. All trends are estimated using ordinary least-squares and box-and-whisker plots follow the methodology used in Figure 10.6. (c) Projections of ensemble mean 2015–2050 linear trends (°C per decade) of CMIP5 (RCP8.5), CORDEX EUR-44 (RCP8.5), CORDEX EUR-11 (RCP8.5), CMIP6 (SSP5-8.5) and HighResMIP (highres-future). All trends are estimated using ordinary least-squares. (d) Projected Mediterranean summer warming in comparison to global annual mean warming of CMIP5 (dashed lines, RCP2.6 in dark blue, RCP4.5 in light blue, RCP6.0 in orange and RCP8.5 in red) and CMIP6 (solid lines, SSP1-2.6 in dark blue, SSP2-4.5 in yellow, SSP3-7.0 in red and SSP5-8.5 in dark red) ensemble means. Further details on data sources and processing are available in the chapter data table (Table 10.SM.11).