Back chapter figures
Figure 10.3
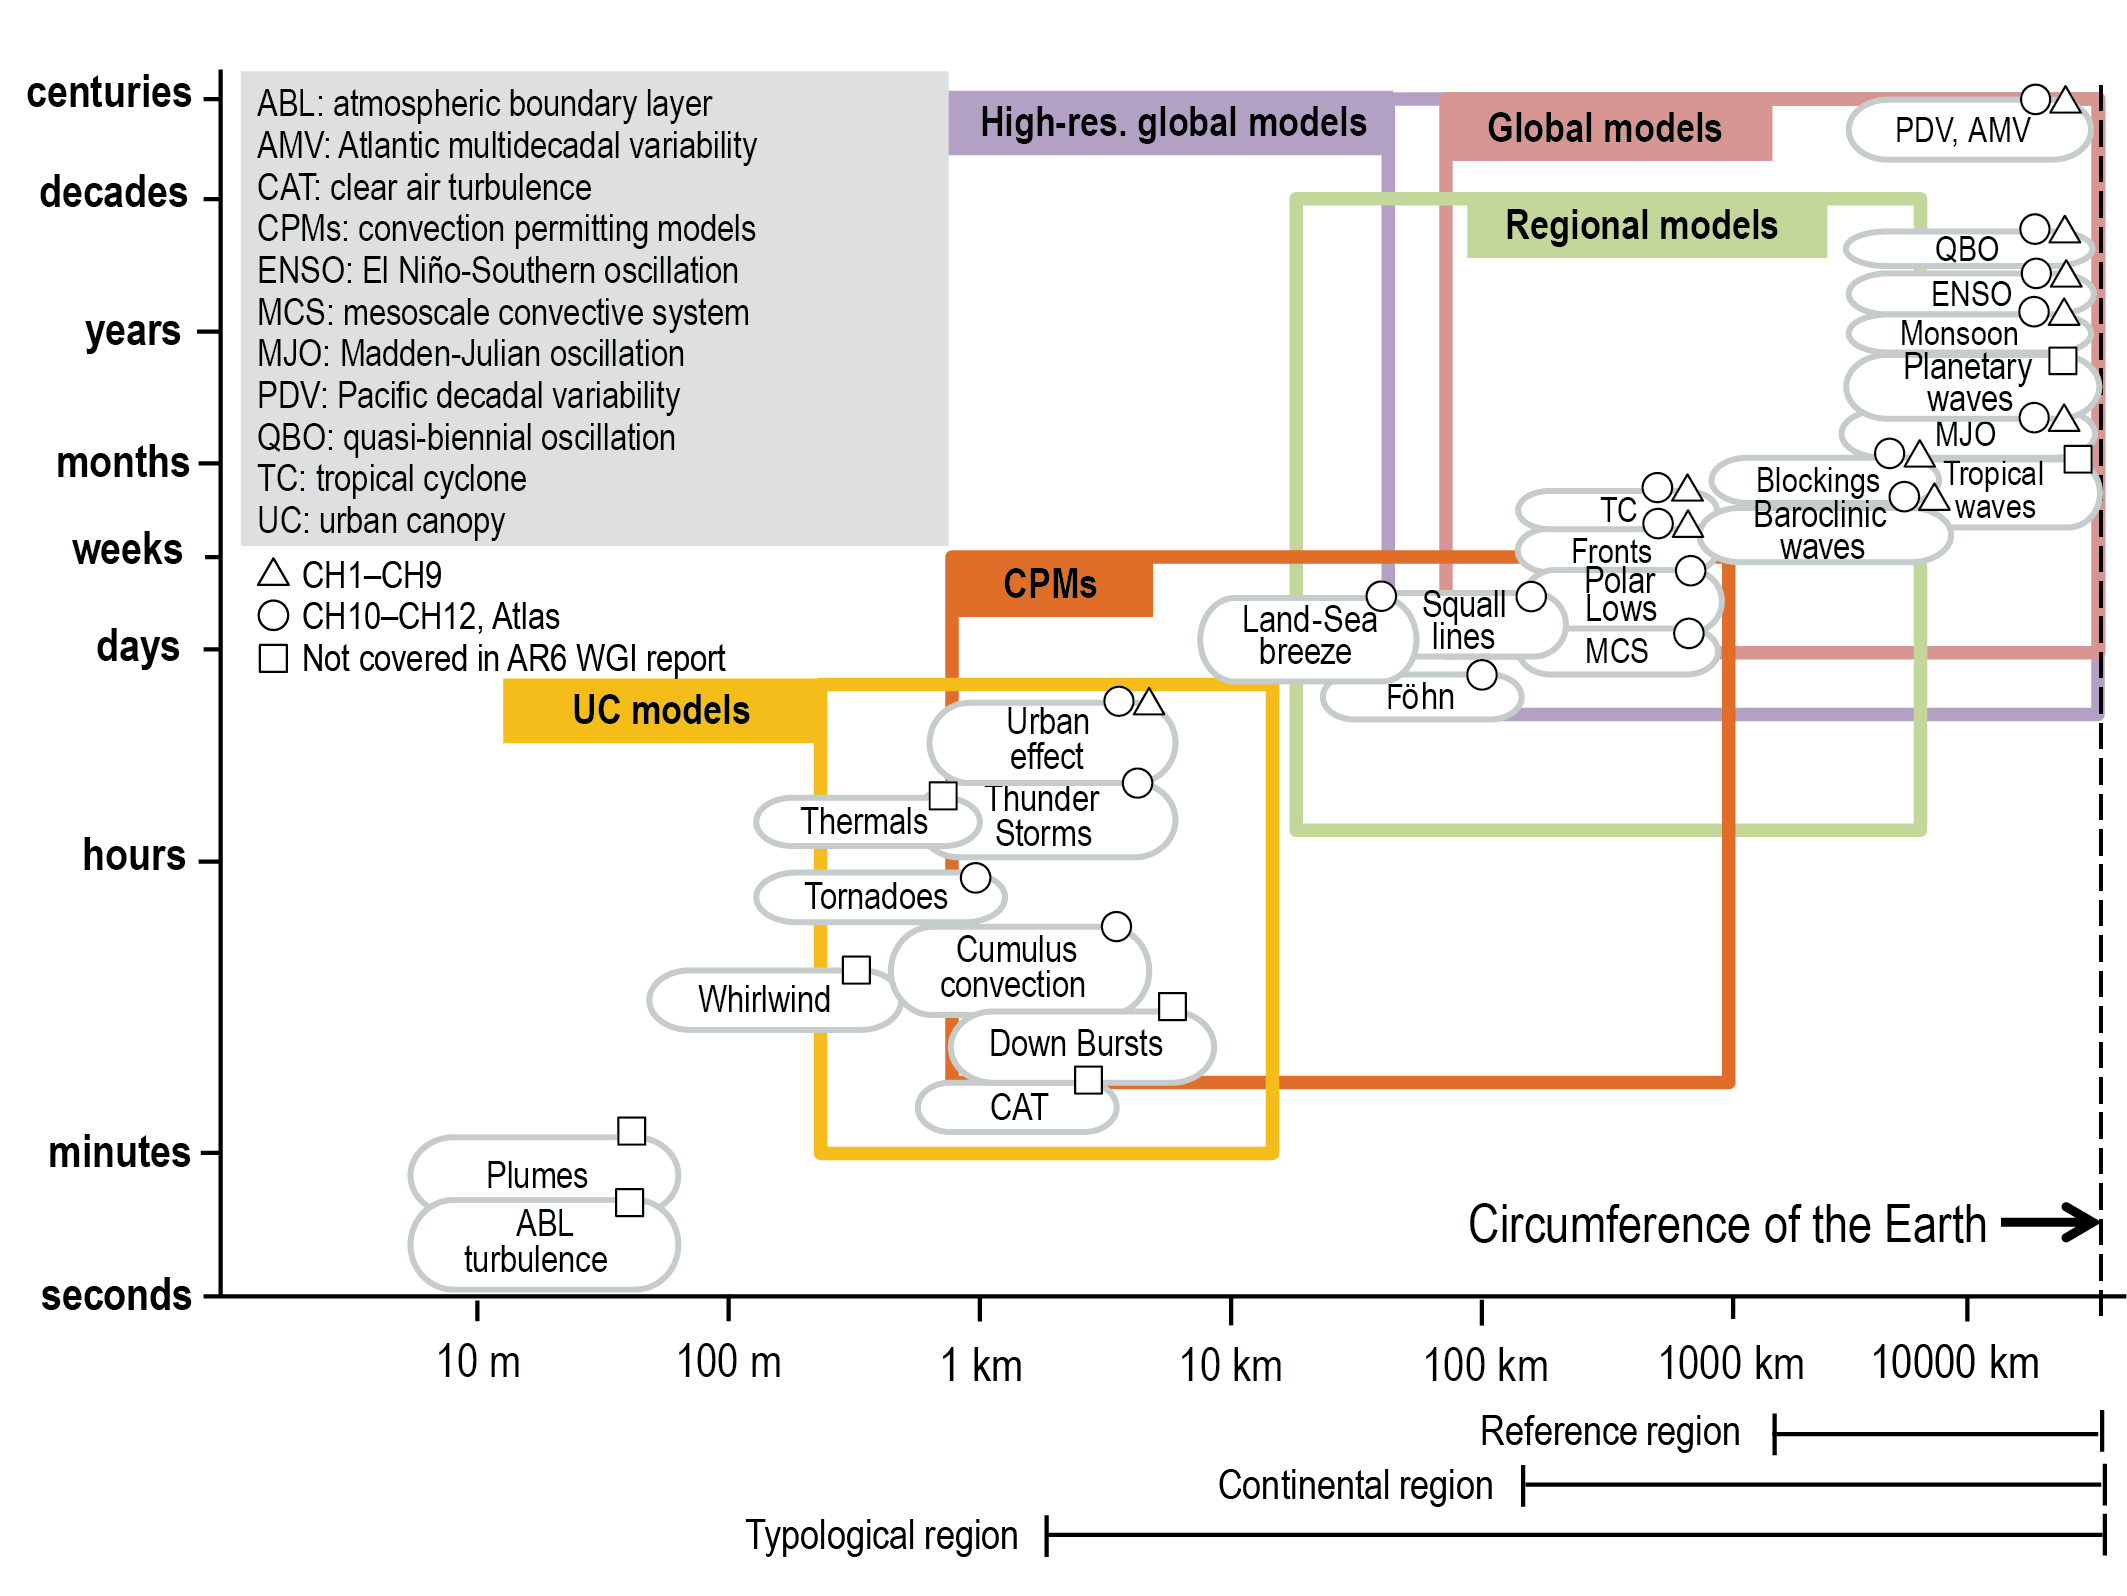
Figure caption
Figure 10.3 | Schematic diagramto display interacting spatial and temporal scales relevant to regional climate change information. Figure adapted from Orlanski (1975). The processes included in the different models and model components considered in Chapter 10 are indicated as a function of these scales. The various types of models (including global and regional climate models) for constructing regional climate information are assessed in Section 10.3.1 and Box 10.3.